. 2009 Aug;297(2):F481-8.
doi: 10.1152/ajprenal.00092.2009. Epub 2009 May 20.

Effect of lowering uric acid on renal disease in the type 2 diabetic db/db mice

Affiliations

Effect of lowering uric acid on renal disease in the type 2 diabetic db/db mice

Tomoki Kosugi et al. Am J Physiol Renal Physiol. 2009 Aug.

Abstract

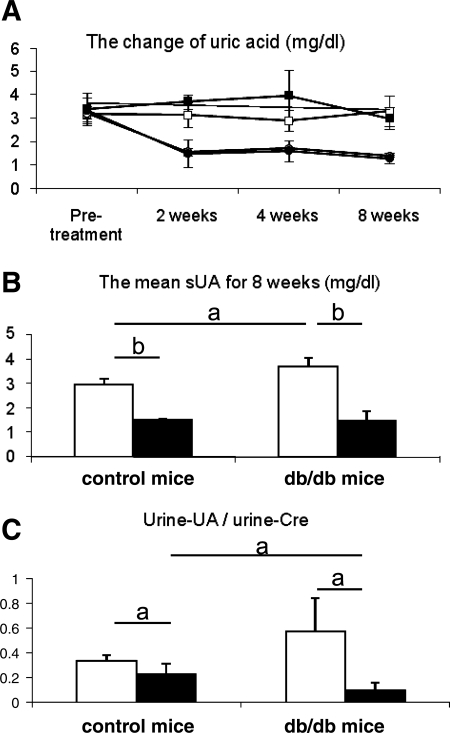
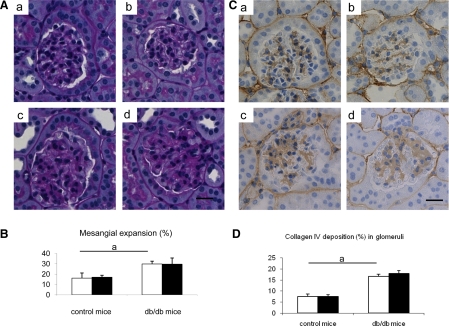
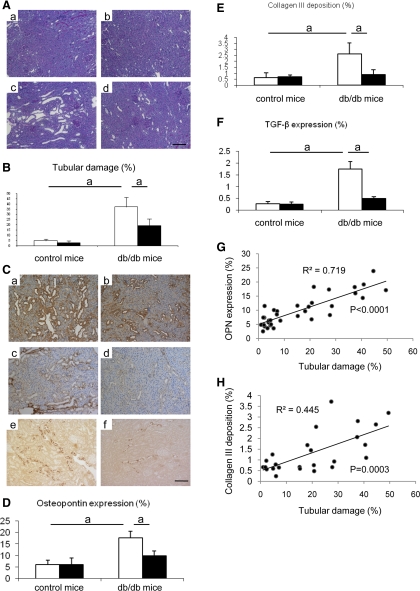
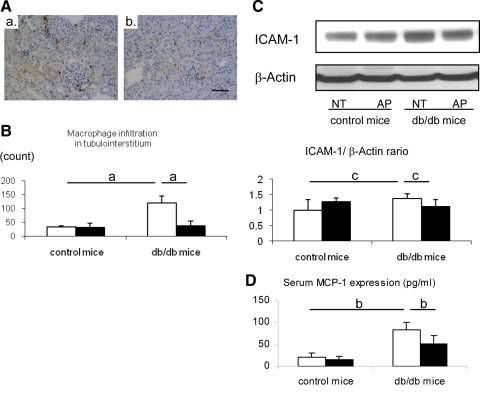
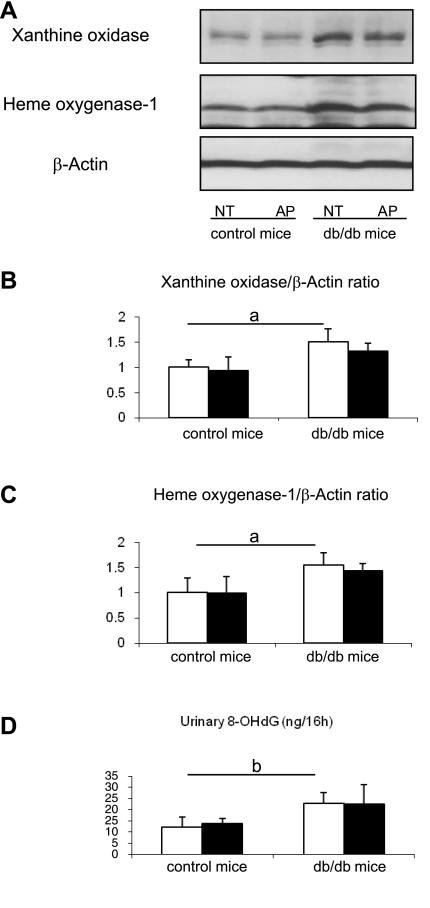
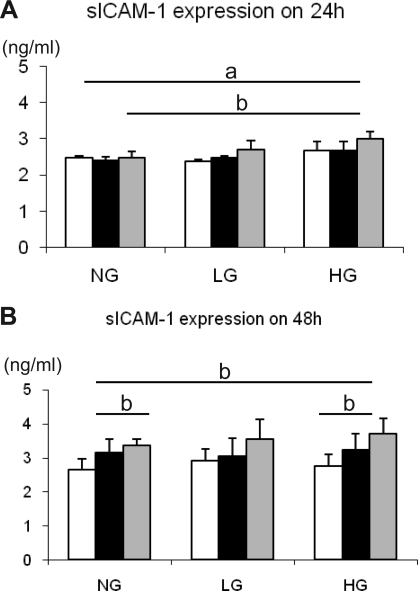
Hyperuricemia has recently been recognized to be a risk factor for nephropathy in the diabetic subject. We tested the hypothesis that lowering uric acid with a xanthine oxidase inhibitor might reduce renal injury in the diabetic mouse. Diabetic (db/db) mice were treated with allopurinol or no treatment for 8 wk. Serum uric acid, renal function, and histology were assessed at death. The direct effect of uric acid in human proximal tubular epithelial cells was also evaluated under normal or high glucose condition. We found that db/db mice developed hyperuricemia, albuminuria, mesangial matrix expansion, and mild tubulointerstitial disease. Allopurinol treatment significantly lowered uric acid levels, reduced albuminuria, and ameliorated tubulointerstitial injury, but it did not prevent mesangial expansion. The mechanism for protection was shown to be due to a reduction in inflammatory cells mediated by a reduction in ICAM-1 expression by tubular epithelial cells. Interestingly, allopurinol did not reduce oxidative stress in the kidney. An inflammatory role of uric acid on tubular cells was also confirmed by our in vitro evidence that uric acid directly induced ICAM-1 expression in the human proximal tubular cell. In conclusion, hyperuricemia has a pathogenic role in the mild tubulointerstitial injury associated with diabetic nephropathy but not glomerular damage in db/db mice. Lowering uric acid may reduce tubulointerstitial injury in diabetes.


Figures

Fig. 1.
Fig. 1.
Uric acid level in serum and urine in db/db mouse. A: change of serum uric acid levels. Serum uric acid tends to be high in db/db mouse compared with control mouse during study period (□, control mice with no treatment; ○, control with allopurinol treatment; ▪, db/db mice with no treatment; •, db/db mice with allopurinol treatment). However, the mean of serum uric acid levels for 8 wk (from 8 to 16 wk age) is significantly high in db/db mouse compared with control mouse. B: allopurinol treatment significantly reduced mean serum uric acid (sUA) level. C: urinary uric acid (UA) excretion is expressed the urine uric acid-to-urine creatinine (Cre) ratio. Urinary uric acid excretion is also significantly high in db/db mouse compared with control mouse. However, it is reduced by allopurinol treatment. □, No treatment; ▪, allopurinol treatment. Data are means ± SD. aP < 0.05; bP < 0.001; n = 10/each group.
Fig. 2.
Fig. 2.
Glomerular changes in db/db mouse. A: glomerular structure in periodic acid-Schiff staining. Compared with control C57BLKS/J mouse (a), db/db mouse exhibits mesangial expansion (c). allopurinol has no effect in glomerulus on both control (b) and db/db mouse (d). B: quantitative analysis for mesangial expansion. C: immunohistochemical staining shows glomerular of collagen IV depositions. Compared with glomeruli in control C57BLKS/J mouse (a), collagen IV deposition (brown color) increased in db/db mouse (c). Allopurinol has no effect on glomerular collagen IV deposition in both control (b) and db/db mouse (d). Bar = 20 μm. D: quantitative data for collagen IV deposition. Open bars, no treatment; filled bars, allopurinol treatment. Data are means ± SD. aP < 0.01; n = 10/each group.
Fig. 3.
Fig. 3.
Tubulointerstitial changes in db/db mouse. A: representative tubularinterstitial injuries are shown in. Compared with tubules in control mouse (a) and in control mouse with allopurinol treatment (b), db/db mouse (c) shows tubularinterstitial injury, as characterized by ballooning tubules and detachment of tubular epithelial cells from tubules. However, allopurinol treatment prevents the development of these lesions (d). B: quantitative analysis for tubulointerstitial injury. C: immunohistochemistry. Nontreated db/db mouse is shown in (a, c, e). db/db mouse with allopurinol treatment is shown in (b, d, f). Compared with nontreated db/db mouse, allopurinol treatment reduces osteopontin (OPN) expression (brown color) in tubules (b), collagen III deposition (brown color) in interstitium (d) and tranforming growth factor-β (TGF-β) expression (brown color) in tubules (f). Bar = 50 μm. Quantitative analysis is shown for OPN expression (D), collagen III deposition (E), and TGF-β expression (F). Also, shown is the correlation of tubular damage with OPN expression (G) and interstitial collagen III deposition (H). Open bars, no treatment; filled bars, allopurinol treatment. Data are means ± SD. aP < 0.01; n = 10/each group.
Fig. 4.
Fig. 4.
Hyperuricemia-induced inflammatory response in db/db mouse. A: macrophage infiltration is examined by using immunohistochemistry for F4/80. Interstitial macrophage infiltration (brown color) is prominent in db/db (a), whereas allopurinol significantly reduces intrarenal macrophage infiltration in db/db mouse (b; bar = 50 μm). Quantitative analysis for F4/80 (+) macrophage infiltration shows that db/db mouse displays significantly increased macrophage infiltration in the renal cortex of db/db mouse. However, it is markedly prevented by allopurinol treatment (B). Western blotting demonstrates that ICAM-1 protein level is significantly increased in the whold kidney of db/db mouse, compared with control mouse. C: allopurinol (AP) significantly blocks the elevation of renal ICAM-1 expression compared with nontreatment mice (NT); quantitative data are expressed as the relative ratio of ICAM-1 to β-actin. D: ELISA assay demonstrates an elevation of serum MCP-1 levels in db/db mice compared with control mice and was blocked by allopurinol treatment. Open bars, no treatment; filled bars, allopurinol treatment. Data are means ± SD. aP < 0.001; bP < 0.005; cP < 0.05; n = 10/each group.
Fig. 5.
Fig. 5.
Oxidative stress in db/db mouse. Hemoxygenase (HO)-1 and xanthine oxidase proteins in whole kidney are examined by western blotting (A). Quantitative results are expressed as the relative ratio of HO-1 (B) or xanthine oxidase (C) to β-actin, respectively. Both HO-1 and xanthine oxidase are significantly high in db/db mice compared with control mice, but these increments are not blocked by allopurinol treatment compared with nontreatment mice. ELISA assay shows that urinary 8-hydroxy-2′-deoxyguanosine (8-OHdG) levels in db/db mice is significantly high compared with control mice, but this induction is not inhibited by allopurinol treatment (D). Open bars, no treatment; filled bars, allopurinol treatment. Data are means ± SD. aP < 0.01; bP < 0.05; n = 10/each group.
Fig. 6.
Fig. 6.
Soluble intercellular adhesion molecule-1 (sICAM-1) expression in response to uric acid in HK-2 cells. HK-2 cells are stimulated by a various concentration of uric acid (0, 7.5, and 15 mg/dl) in the presence of normal d-glucose (5.4 mM; NG) or high d-glucose (HG; 25 mM) at 1 (A) and 2 days (B). l-glucose (LG) was used to examine the same level of osmotic pressure as 25 mM d-glucose loading. Open bars, 0 mg/dl uric acid; filled bars, 7.5 mg/dl uric acid; grey bars, 15 mg/dl uric acid. Data are means ± SD. aP < 0.01; bP < 0.05; n = 10/each group.

References

    1. Afshari M, Larijani B, Rezaie A, Mojtahedi A, Zamani MJ, Astanehi-Asghari F, Mostafalou S, Hosseinnezhad A, Heshmat R, Abdollahi M. Ineffectiveness of allopurinol in reduction of oxidative stress in diabetic patients; a randomized, double-blind placebo-controlled clinical trial. Biomed Pharmacother 58: 546–550, 2004. - PubMed
    1. Bo S, Cavallo-Perin P, Gentile L, Repetti E, Pagano G. Hypouricemia and hyperuricemia in type 2 diabetes: two different phenotypes. Eur J Clin Invest 31: 318–321, 2001. - PubMed
    1. Desco MC, Asensi M, Marquez R, Martinez-Valls J, Vento M, Pallardo FV, Sastre J, Vina J. Xanthine oxidase is involved in free radical production in type 1 diabetes: protection by allopurinol. Diabetes 51: 1118–1124, 2002. - PubMed
    1. Feig DI, Johnson RJ. Hyperuricemia in childhood primary hypertension. Hypertension 42: 247–252, 2003. - PMC - PubMed
    1. Feig DI, Kang DH, Johnson RJ. Uric acid and cardiovascular risk. N Engl J Med 359: 1811–1821, 2008. - PMC - PubMed

Publication types

MeSH terms