. 2009 Jul;102(1):532-45.
doi: 10.1152/jn.00305.2009. Epub 2009 May 20.

Sparse but selective and potent synaptic transmission from the globus pallidus to the subthalamic nucleus

Affiliations

Sparse but selective and potent synaptic transmission from the globus pallidus to the subthalamic nucleus

Jérôme Baufreton et al. J Neurophysiol. 2009 Jul.

Abstract

The reciprocally connected GABAergic globus pallidus (GP)-glutamatergic subthalamic nucleus (STN) network is critical for voluntary movement and an important site of dysfunction in movement disorders such as Parkinson's disease. Although the GP is a key determinant of STN activity, correlated GP-STN activity is rare under normal conditions. Here we define fundamental features of the GP-STN connection that contribute to poorly correlated GP-STN activity. Juxtacellular labeling of single GP neurons in vivo and stereological estimation of the total number of GABAergic GP-STN synapses suggest that the GP-STN connection is surprisingly sparse: single GP neurons maximally contact only 2% of STN neurons and single STN neurons maximally receive input from 2% of GP neurons. However, GP-STN connectivity may be considerably more selective than even these estimates imply. Light and electron microscopic analyses revealed that single GP axons give rise to sparsely distributed terminal clusters, many of which correspond to multiple synapses with individual STN neurons. Application of the minimal stimulation technique in brain slices confirmed that STN neurons receive multisynaptic unitary inputs and that these inputs largely arise from different sets of GABAergic axons. Finally, the dynamic-clamp technique was applied to quantify the impact of GP-STN inputs on STN activity. Small fractions of GP-STN input were sufficiently powerful to inhibit and synchronize the autonomous activity of STN neurons. Together these data are consistent with the conclusion that the rarity of correlated GP-STN activity in vivo is due to the sparsity and selectivity, rather than the potency, of GP-STN synaptic connections.


Figures

FIG. 1.
FIG. 1.
Individual globus pallidus (GP neurons form sparse terminal fields in the subthalamic nucleus (STN). A and B: light micrographs of single GP neurons that were juxtacellularly labeled in vivo. In A, the tissue has also been immunolabeled for parvalbumin, which is expressed by a subpopulation of neurons in the GP. The juxtacellularly labeled GP neuron, which was revealed using diaminobenzidine (DAB) in the presence of Ni2+, is easily distinguished from parvalbumin immunoreactive neurons, which were revealed using DAB, on the basis of labeling intensity and color (not apparent here). C, 1 and 2: labeled axonal boutons (small arrows) arising from a GP axon occurred in small clusters that were distributed at low density across the STN. The dashed lines mark the boundary between the striatum (CPu) and GP in A and B and the boundary between the zona incerta (ZI) and the STN in C1 and C2. The internal capsule (IC) underlying the STN is visible in C1. Scale in A also applies to B. Scale in C1 also applies to C2.
FIG. 2.
FIG. 2.
Estimation of the density of GABA-immunoreactive GP-STN synapses. A–C, 1 and 2: examples of pairs of adjacent ultrathin sections in which GABA-immunoreactive symmetrical synaptic contacts (arrows) were “counted” using the dissector technique, i.e., they were present in the “reference” section (A1, B1, C1) but not in the adjacent “look-up” section (A2, B2, C2). Note the relatively high density of immunogold particles in terminals (*) that form symmetrical synaptic contacts compared with immunonegative structures such as terminals (•) that form asymmetric synaptic contacts (arrowhead) or the dendrites (d) or somata (s) of STN neurons. Two GABA-immunoreactive terminals formed symmetrical synapses in both sections (A) and were therefore not counted. Myelinated GABA-immunoreactive axons (a) are also present in some micrographs (B and C). Scale bar in C2 applies to each panel.
FIG. 3.
FIG. 3.
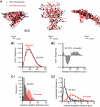
Three-dimensional distribution of GP-STN terminals. A: sagittal, horizontal and coronal projections (left, middle, and right, respectively) of a GP-STN terminal field that arose from a single labeled GP neuron. Each black dot represents 1 of 455 labeled GP-STN terminals. Red dots represent an equivalent number of terminals that have been arranged at random (simulated) within the volume occupied by the GP-STN terminal field, the boundaries of which are indicated (for each tissue section) by gray lines. B1: comparison of frequency histograms of all interterminal distances for GP-STN (black) and simulated (red) terminal fields indicates that the GP-STN field possessed a greater proportion of interterminal distances at the extremes of the distribution. B2: subtraction of the simulated field from the GP-STN field confirmed this trend. C1: the distance between nearest neighboring terminals was smaller for the GP-STN terminal field (black) than the simulated field (red). C2: population data from 10 labeled GP neurons confirms that the distance between nearest neighboring terminals was smaller for GP-STN than simulated terminal fields. GP-STN and simulated fields were well fit by a log normal distribution with peaks at 3.5 and 14.8 μm, respectively.
FIG. 4.
FIG. 4.
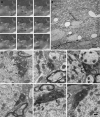
Individual GP axons often form multiple synaptic contacts with individual STN neurons. A–C: correlated light (A) and electron microscopic (B and C) analyses of a cluster of GP-STN terminals that arose from an individual GP neuron. A: from left to right, through-focus light micrographs of a cluster of labeled GP-STN terminals (1–11). Capillaries (c1–c4) act as points of registration between the light and electron micrographic images. B: a low-magnification electron micrograph of the region in A. C: high-magnification electron micrographs of 6 terminals (1, 3, 5, 8, 10, 11) that formed symmetrical synaptic contacts (arrows) with a proximal dendrite (d) and soma (s) of a single STN neuron. The other terminals formed synaptic contacts with other STN dendrites (not illustrated). The scales in A and C apply to all panels in A and C, respectively.
FIG. 5.
FIG. 5.
Minimally evoked inhibitory postsynaptic currents (IPSCs) are significantly larger than miniature IPSCs (mIPSCs) in STN neurons. A: responses evoked in a single STN neuron to electrical stimulation of the internal capsule with gradually increasing intensity (10 superimposed trials in each panel; onset of stimulation denoted by the gray dashed line). A and B: at 10 μA a large IPSC was evoked in 3 of 10 trials. As the stimulation intensity was increased the number of transmission failures decreased but the mean amplitude of minimally evoked IPSCs remained constant. The sharp threshold and consistent latencies, mean amplitudes and kinetics of the evoked IPSCs suggest that they result from minimal stimulation, that is, stimulation of a single GP-STN axon. The large and variable amplitude of minimally evoked IPSCs compared with those observed in the presence of TTX (C and D) suggest that single GP-STN axons transmit via several synapses. C: representative recording of mIPSCs in the presence of 1 μM TTX. The current scales in A and C are identical for comparison. D: the mean and maximal amplitudes of minimally evoked IPSCs (n = 24 neurons) were significantly greater than mIPSCs recorded in the presence of TTX (n = 17 neurons). Asterisk, P < 0.05.
FIG. 6.
FIG. 6.
Neighboring STN neurons receive inputs from different GP-STN axons. A: through-focus micrographs of 2 neighboring STN neurons (1 and 2) that were recorded simultaneously in the whole cell configuration. B: superimposed (left; 50 trials) and mean (right) responses of neurons 1 and 2 to minimal stimulation of the internal capsule. The gray dashed lines indicate the onset of electrical stimulation. Numerous spontaneous IPSCs were also detected. C: as for B except that a different combination of electrodes were chosen for minimal stimulation. Note that different neurons respond to each stimulus and that minimally evoked IPSCs varied greatly in amplitude in both neurons.
FIG. 7.
FIG. 7.
Resetting of autonomous activity by synthetic GP-STN inhibition. A: impact of synthetic GABAA receptor-mediated IPSPs with underlying conductances of 1–25 nS on the autonomous activity of a STN neuron. Twenty superimposed trials are illustrated for each conductance. The time of onset of each IPSP is denoted by a dashed red line. A pause in activity and resetting of action potential generation is discernable for 5- to 25-nS IPSPs. The variability in the timing of action potentials generated after each IPSP decreased as the conductance increased over the 5–25 nS range. B: population data for the latency (left) and SD (right) of the 1st action potential generated after each IPSP plotted against the underlying conductance (gIPSP). Data from each neuron tested (n = 7) are represented by a distinct color and symbol (neuron in A is denoted by purple lines and symbols). The color code is consistent with Fig. 8. C: population data for the peak hyperpolarization generated by each IPSP (IPSPpeak, left) and the magnitude of each IPSP (IPSPmagnitude = membrane potential at which IPSP was evoked –IPSPpeak, right) plotted against the conductance underlying each IPSP. The peak of the IPSP progressively approached the equilibrium potential of the synaptic input and increased in magnitude as the conductance increased.
FIG. 8.
FIG. 8.
Synchronization of autonomous STN activity by synthetic GP-STN inhibition. Color-coded raster plots for 7 STN neurons (color code as for Fig. 7) illustrating the action of synthetic GABAA receptor-mediated IPSPs (that were generated at 0 s with underlying conductances of 1–25 nS) on autonomous firing. A peristimulus time histogram (PSTH) is to the right of its respective raster plot. The black line on each PSTH represents the mean number of action potentials per time bin of 10 ms in the period (−1.5 to 0 s) before synthetic inhibition. The gray lines represent the mean ±3 SD of action potentials per time bin before inhibition. Correlated activity, as shown by significant peaks and troughs in the PSTHs, was observed for synthetic IPSPs with underlying peak conductances of 5–25 nS. The degree of correlation increased progressively as the conductance underlying the synthetic IPSP increased.

Similar articles

Cited by

References

    1. Abbott LF, Regehr WG. Synaptic computation. Nature 431: 796–803, 2004. - PubMed
    1. Albin RL, Young AB, Penney JB. The functional anatomy of basal ganglia disorders. Trends Neurosci 12: 366–375, 1989. - PubMed
    1. Atherton JF, Wokosin DL, Ramanathan S, Bevan MD. Autonomous initiation and propagation of action potentials in neurons of the subthalamic nucleus. J Physiol 586: 5679–5700, 2008. - PMC - PubMed
    1. Baufreton J, Atherton JF, Surmeier DJ, Bevan MD. Enhancement of excitatory synaptic integration by GABAergic inhibition in the subthalamic nucleus. J Neurosci 25: 8505–8517, 2005. - PMC - PubMed
    1. Baufreton J, Bevan MD. D2-like dopamine receptor-mediated modulation of activity-dependent plasticity at GABAergic synapses in the subthalamic nucleus. J Physiol 586: 2121–2142, 2008. - PMC - PubMed

Publication types

MeSH terms

LinkOut - more resources