. 2009 Jul;20(14):3261-72.
doi: 10.1091/mbc.e09-01-0071. Epub 2009 May 20.

Plasma membrane area increases with spread area by exocytosis of a GPI-anchored protein compartment

Affiliations

Plasma membrane area increases with spread area by exocytosis of a GPI-anchored protein compartment

Nils C Gauthier et al. Mol Biol Cell. 2009 Jul.

Abstract

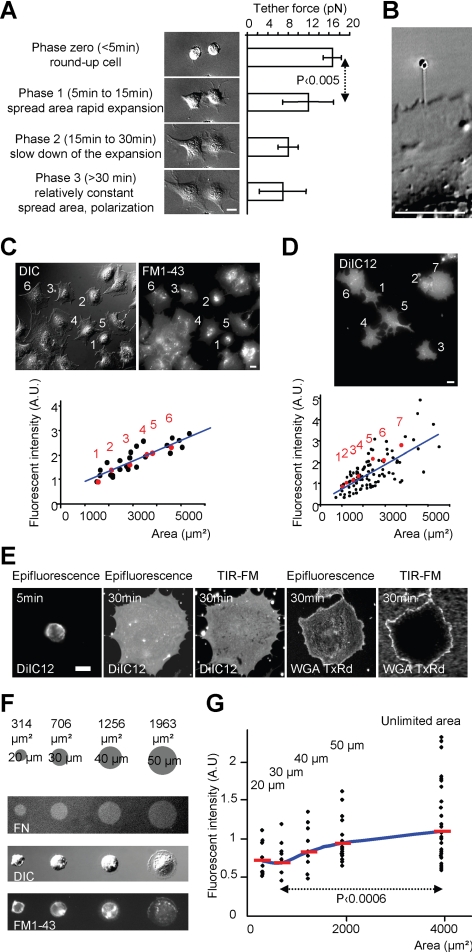
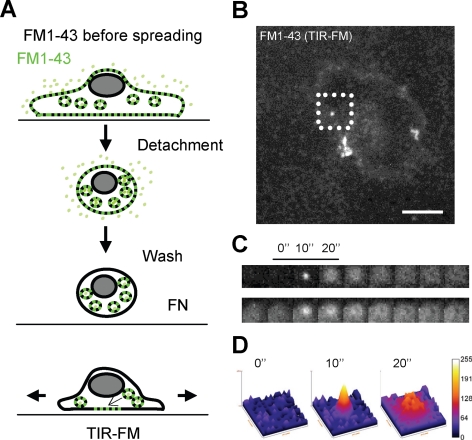
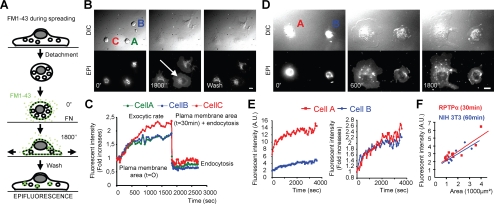
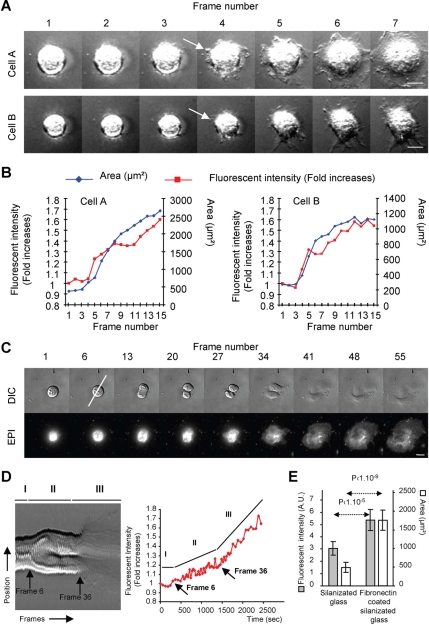
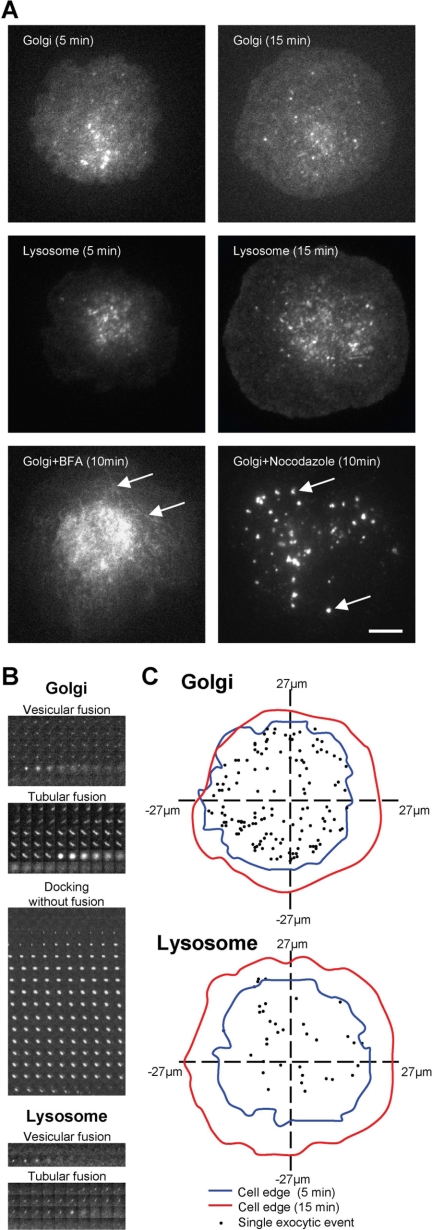
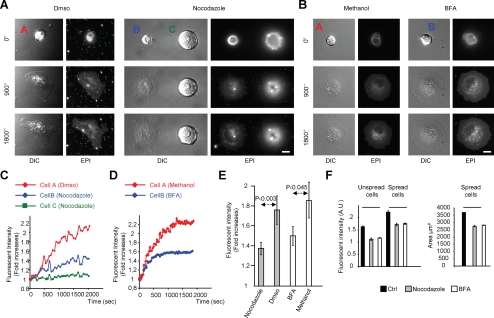
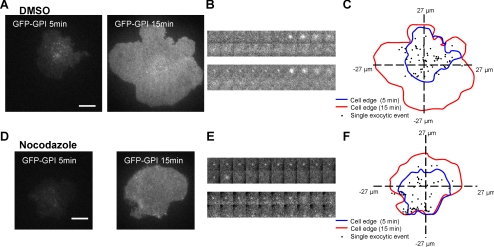
The role of plasma membrane (PM) area as a critical factor during cell motility is poorly understood, mainly due to an inability to precisely follow PM area dynamics. To address this fundamental question, we developed static and dynamic assays to follow exocytosis, endocytosis, and PM area changes during fibroblast spreading. Because the PM area cannot increase by stretch, spreading proceeds by the flattening of membrane folds and/or by the addition of new membrane. Using laser tweezers, we found that PM tension progressively decreases during spreading, suggesting the addition of new membrane. Next, we found that exocytosis increases the PM area by 40-60% during spreading. Reducing PM area reduced spread area, and, in a reciprocal manner, reducing spreadable area reduced PM area, indicating the interconnection between these two parameters. We observed that Golgi, lysosomes, and glycosylphosphatidylinositol-anchored protein vesicles are exocytosed during spreading, but endoplasmic reticulum and transferrin receptor-containing vesicles are not. Microtubule depolymerization blocks lysosome and Golgi exocytosis but not the exocytosis of glycosylphosphatidylinositol-anchored protein vesicles or PM area increase. Therefore, we suggest that fibroblasts are able to regulate about half of their original PM area by the addition of membrane via a glycosylphosphatidylinositol-anchored protein compartment.


Figures

Figure 1.
Figure 1.
Cell spreading is accompanied by a decrease in PM tension and an increase in PM area, increase proportional to substrate contact area. (A) Average tether forces (at least 5 tethers from different cells) in NIH-3T3 cells during the spreading phases (Dubin-Thaler et al., 2004; Giannone et al., 2004). Error bars, SD (B) DIC image of a tether pulled from an RPTPα fibroblast. Scale, 5 μm. (C) DIC and epifluorescence acquisition of RPTPα cells after incubation at 4°C with FM1-43. Bar, 10 μm. The numbered cells are presented in the graph in which FM1-43 fluorescence intensity (representing PM area) was plotted as a function of substrate contact area for 30 RPTPα cells from one typical experiment. Fitting line is in blue. (D) Same as panel C but only epifluorescence acquisition with DiIC12 dye for 100 RPTPα cells. (E) TIR-FM analysis of the cells was performed, revealing that DiIC12 efficiently labeled the PM area facing the coverslip, during the acquisitions performed at 4°C. WGA was unable to stain that part of the PM. (F) Example of patterned circles coated with fibronectin (FN) onto which cells has been spread for 45 min and incubated at 4°C with FM1-43. (G) FM1-43 fluorescence intensity (representing total PM area) was plotted as a function of substrate contact area for one typical experiment. Each black dot represents a cell. Mean fluorescence intensity, red dashes; best fit for mean fluorescence intensity, blue line. For unlimited substrate contact area, the plotted area represents the average of substrate contact areas on that region.
Figure 2.
Figure 2.
Membrane exocytosis occurs during cell spreading. (A) Schematic representation of the FM1-43 before spreading protocol (see Materials and Methods). (B) Example of RPTPα cell TIR-FM images during spreading. Bar, 10 μm. (C) Sequential presentation of two vesicle fusions with the PM extracted from the Supplemental Video 1 (square selection from b is presented in the top row). (D) Fluorescence intensity surface plot analysis of the vesicle fusion presented in the top row of C. Height and colors range represents intensity.
Figure 3.
Figure 3.
PM area increase is due to the balance between exocytosis and endocytosis. (A) Schematic representation of the FM1-43 during spreading protocol (see Materials and Methods). (B) RPTPα cells using the FM1-43 during spreading protocol. Arrow, perinuclear region brightening showing endocytosis. Bar, 10 μm. (C). FM1-43 fluorescence intensity (-fold increases, compared with the initial FM1-43 fluorescence intensity at t = 0″) of each cells plotted as a function of time. (D) Same as B, but without wash and for cells presenting a significant difference in size. (E) FM1-43 fluorescence intensity and fluorescence intensity -fold increases plotted as a function of time for each cell presented in D. (F) Substrate contact area plotted in function of the initial PM area (represented by the FM1-43 fluorescence intensity at t = 0″) after 30 min of spreading for RPTPα cells (red dots and red fitting line; n = 10) and 60 min of spreading for NIH-3T3 cells (blue dots and blue fitting line; n = 10).
Figure 4.
Figure 4.
Membrane exocytosis is induced by spreading. (A) Consecutive seven DIC frames acquired at 120-s intervals presented sequentially for two NIH-3T3 cells (Supplemental Figure 2 and Supplemental Video 3). The arrows point to the first expansions presented by the cells. Bar, 10 μm. (B) FM1-43 fluorescence intensity (-fold increase) and substrate contact area of the two cells plotted as a function of frame number. (C) Images of RPTPα cell analyzed with the FM1-43 during spreading protocol during mitosis and postmitotic spreading. Bar, 10 μm. (D) Left, kemograph analysis of the line depicted in C. Different stages of cell division can be identified: before anaphase (I), anaphase to cytokinesis (II), and postmitotic spreading (III). Right, FM1-43 fluorescence intensity -fold increases plotted as a function of time. The three cell division stages correspond to three exocytosis rates: no exocytosis (I), moderate exocytosis (II), and rapid exocytosis (III). (E) NIH-3T3 cells analyzed using the FM1-43 during spreading protocol, after 60 min of spreading from uncoated or fibronectin-coated regions of the same coverslip. Averages of FM1-43 fluorescence intensity and area per cell are presented. Errors bars, SD. n = 50 cells from a typical experiment.
Figure 5.
Figure 5.
Microtubule-dependent exocytosis of Golgi and LY occurs during spreading. (A) Examples of TIR-FM images for YFP-Golgi– or GFP-Lamp1 (LY)–expressing cells at 5 and 15 min of spreading. Arrows shows the tubular aspect of the Golgi compartment under BFA treatment and its disperse vesicular aspect under nocodazole. Bar, 10 μm. (B) Sequential presentation of different vesicle behaviors analyzed with TIR-FM. Images were recorded every 0.25 s for YFP-Golgi and 0.33 s for GFP-Lamp1. (C) Spatial mapping of all the recordable exocytic events occurring for the cells presented in A.
Figure 6.
Figure 6.
Microtubule-dependent exocytosis participate in plasma membrane homeostasis but not in PM area increase during spreading. (A) Comparison of DMSO (control) and nocodazole-treated RPTPα cells during spreading by using the FM1-43 during spreading protocol. Bar, 10 μm. (B) Comparison of methanol (control) and BFA-treated RPTPα cells during spreading using the FM1-43 during spreading protocol. Bar, 10 μm. (C) FM1-43 fluorescence intensity (-fold increases) of each cell presented in A plotted as a function of time. (D) FM1-43 fluorescence intensity (-fold increases) of each cells presented in B plotted in function of time. (E) Averages of FM1-43 fluorescence intensity (-fold increases) for RPTPα cell after 30 min of spreading. Error bars represent SD between 20 cells from 10 independent experiments (nocodazole or DMSO) or between six cells from two independent experiments (BFA and methanol). (F) Left histogram, FM1-43 fluorescence intensity (representing PM area) of RPTPα cells for unspread cells and 30-min spread cells. Right histogram, area of 30-min spread cells. Each error bar represents the SD of the means for three independent experiments. In each experiment, n = 30 cells (for control [Ctrl], nocodazole, or BFA).
Figure 7.
Figure 7.
Exocytosis of the GPI-anchored proteins occurs during cell spreading in a microtubule-independent manner. (A) Examples of TIR-FM images for a GFP-GPI–expressing RPTPα cell at 5 and 15 min of spreading in DMSO. Bar, 10 μm. (B) Sequential presentation of two vesicle fusion analyzed with TIR-FM. Images were recorded every 0.14 s. (C) Examples of the spatial mapping of all the recordable exocytic events occurring for the cell presented in A. For D, E, and F, same as above for a nocodazole-treated cell.

Comment in

  • Mol Biol Cell. 20:3169.

References

    1. Andrews N. W., Chakrabarti S. There's more to life than neurotransmission: the regulation of exocytosis by synaptotagmin VII. Trends Cell Biol. 2005;15:626–631. - PubMed
    1. Balasubramanian N., Scott D. W., Castle J. D., Casanova J. E., Schwartz M. A. Arf6 and microtubules in adhesion-dependent trafficking of lipid rafts. Nat. Cell Biol. 2007;9:1381–1391. - PMC - PubMed
    1. Benmerah A., Lamaze C. Clathrin-coated pits: vive la difference? Traffic. 2007;8:970–982. - PubMed
    1. Bergmann J. E., Kupfer A., Singer S. J. Membrane insertion at the leading edge of motile fibroblasts. Proc. Natl. Acad. Sci. USA. 1983;80:1367–1371. - PMC - PubMed
    1. Boucrot E., Kirchhausen T. Endosomal recycling controls plasma membrane area during mitosis. Proc. Natl. Acad. Sci. USA. 2007;104:7939–7944. - PMC - PubMed

Publication types

Substances

LinkOut - more resources