. 2009 Jul;20(14):3178-91.
doi: 10.1091/mbc.e09-01-0040. Epub 2009 May 20.

Stress-induced phenotypic switching in Candida albicans

Affiliations

Stress-induced phenotypic switching in Candida albicans

Kevin Alby et al. Mol Biol Cell. 2009 Jul.

Abstract

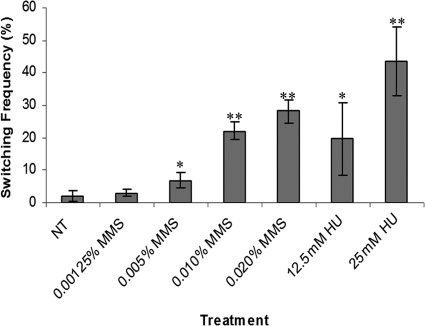
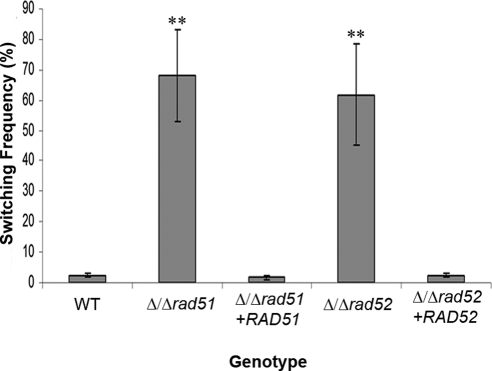
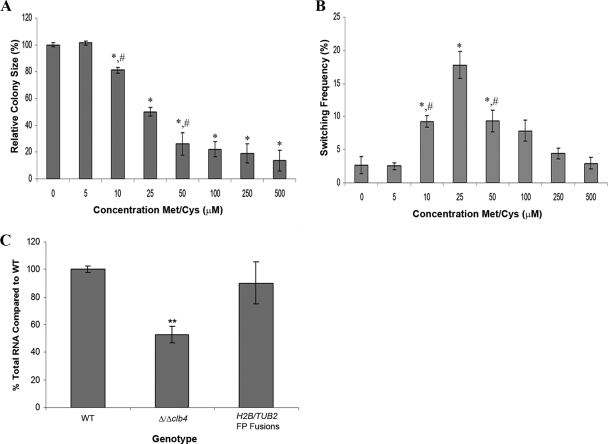
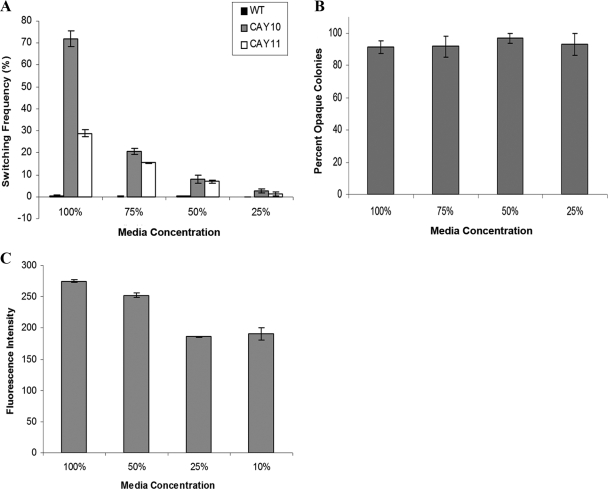
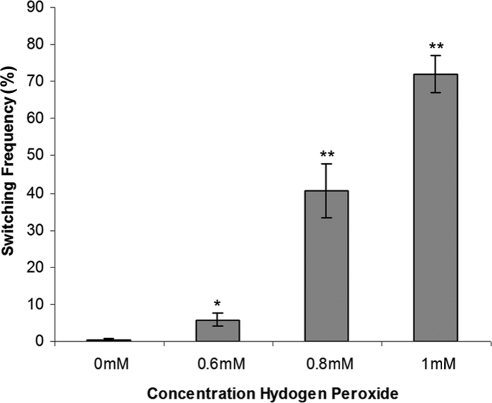
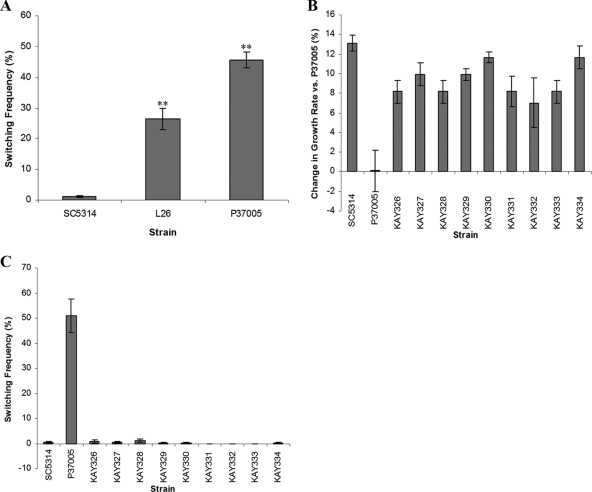
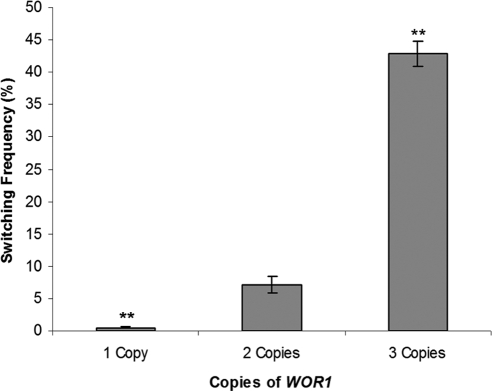
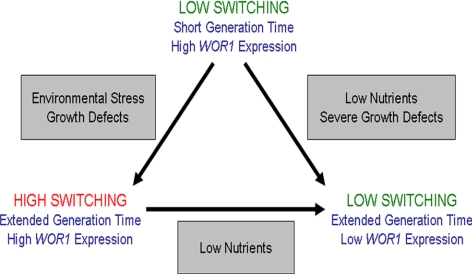
Candida albicans is both a common commensal and an opportunistic pathogen, being a prevalent cause of mucosal and systemic infections in humans. Phenotypic switching between white and opaque forms is a reversible transition that influences virulence, mating behavior, and biofilm formation. In this work, we show that a wide range of factors induces high rates of switching from white to opaque. These factors include different forms of environmental stimuli such as genotoxic and oxidative stress, as well as intrinsic factors such as mutations in DNA repair genes. We propose that these factors increase switching to the opaque phase via a common mechanism-inhibition of cell growth. To confirm this hypothesis, growth rates were artificially manipulated by varying expression of the CLB4 cyclin gene; slowing cell growth by depleting CLB4 resulted in a concomitant increase in white-opaque switching. Furthermore, two clinical isolates of C. albicans, P37005 and L26, were found to naturally exhibit both slow growth and high rates of white-opaque switching. Notably, suppression of the slow growth phenotype suppressed hyperswitching in the P37005 isolate. Based on the sensitivity of the switch to levels of the master regulator Wor1, we propose a model for how changes in cellular growth modulate white-opaque switching frequencies.


Figures

Figure 1.
Figure 1.
Genotoxic stress increases white-to-opaque switching. White cells from wild-type SC5314 a/a or α/α strains (RBY1153 or DSY246/247) were plated on SCD medium containing increasing amounts of genotoxic agents and grown at room temperature for 7 d. Colonies were then counted and scored for opaque sectors. Data are combined from a minimum of two independent experiments for each strain. NT, no treatment. Error bars represent SE. *p < 0.01 compared with no treatment control. **p < 0.0001 compared with the control.
Figure 2.
Figure 2.
Deletion of RAD51 or RAD52 results in increased white-to-opaque switching. White cells from wild-type (WT, RBY1153), Δ/Δrad51 (RBY1154/55), Δ/Δrad52 (RBY1156/57), or reconstituted strains (CAY6/7 and KAY111) were plated on SCD medium and grown at room temperature for 7 d. Colonies were counted and scored for opaque sectors. Opaque sectors for Δ/Δrad52 colonies were confirmed using fluorescence microscopy for Wor1-YFP (see Supplemental Figure S1). Data are combined from three independent experiments for each strain. Error bars represent SE. **p < 0.0001 compared with wild-type cells.
Figure 3.
Figure 3.
Titrating CLB4 cyclin expression results in altered white-opaque switching frequencies. (A) Size of PMET3-CLB4 colonies. White cells expressing PMET3-CLB4 were plated on synthetic medium containing increasing amounts of methionine (Met) and cysteine (Cys) and grown at room temperature for 3 d. Colonies were subsequently analyzed using ImageJ software to determine relative colony size. Approximately 100 total colonies from three independent strains (KAY55/60/61) were analyzed at each concentration. Single cell time-lapse microscopy confirmed that smaller colonies exhibited slower generation times; cells grown on 50 μM Met/Cys grew 53% slower than cells grown on medium without Met/Cys. (B) Switching frequency of PMET3-CLB4 strains. White phase PMET3-CLB4 cells were plated on synthetic medium containing varying amounts of methionine and cysteine and grown at room temperature for 7 d. Colonies were analyzed for opaque sectors. Data are combined for three experiments using three strains (KAY55/60/61). Error bars represent SE. *p < 0.0001 compared with plates/cultures containing no Met/Cys. #p < 0.01 compared with plates containing 25 μM Met/Cys. (C) Total RNA concentrations in switching and nonswitching strains of C. albicans. Total RNA was isolated from wild-type (RBY1153/DSY247), Δ/Δclb4 (CAY70/71), and H2B/TUB2 FP-expressing (RSY240/247) strain. The Δ/Δclb4 strains and H2B/TUB2 fluorescent strain are both slow growing but the Δ/Δclb4 strain does not exhibit increased rates of white-to-opaque switching due to limited RNA expression (see text for details). Error bars represent SE. **p < 0.0002 compared with SC5314.
Figure 4.
Figure 4.
Nutrient levels affect white-to-opaque switching frequencies. (A) White-to-opaque switching on dilute media. White cells were plated on SCD medium (100% medium) or on diluted SCD medium (25–75%) and grown at room temperature for 7 d. Colonies were counted and analyzed for opaque sectors. Black bars represent average switching frequencies of wild-type strains (RBY1153 and DSY246/247). Gray and white bars represent switching frequencies of two hyperswitching strains (rad52 mutant strains) CAY10 and CAY11, respectively. (B) Opaque-to-white switching on dilute media. Opaque phase cells from wild-type strain RBY1153 were plated on different concentrations of SCD medium and grown at room temperature for 7 d. Colonies were counted and analyzed for presence of white phase cells. (C) Cellular metabolism in dilute media. Cells containing GFP under the control of the ACT1 promoter were grown in different concentrations of SCD and analyzed for mean fluorescence intensity by flow cytometry. Note that dilution of the media did not compromise cellular growth rates until media was 25% or lower in concentration (data not shown), so that changes in growth rates were not observed until culture conditions limited general cell metabolism. Data are combined from three experiments. Error bars represent SE.
Figure 5.
Figure 5.
Oxidative stress induces white-to-opaque switching. white cells from wild-type SC5314 a/a or α/α strains (RBY1153/DSY247) were plated on SCD medium containing increasing amounts of hydrogen peroxide and grown at room temperature for 7 d. Colonies were then counted and scored for opaque sectors. Data are combined from a minimum of two independent experiments for each strain. Error bars represent SE. *p < 0.01 compared with no treatment control. **p < 0.0001 compared with the control.
Figure 6.
Figure 6.
Naturally occurring a/a isolates show high rates of white-to-opaque switching due to slow growth. (A) Switching frequency of clinical isolates. White cells from the a/a clinical isolates P37005 and L26 were plated on SCD medium and grown at room temperature for 7 d. Colonies were counted and analyzed for white-to-opaque switching events. (B) Growth rate analysis of faster growing isolates. The a/a clinical isolate P37005 was subjected to serial passaging in YPD media for 7 d. In total, nine independent faster growing isolates (KAY326–334) were subjected to further analysis. The growth rates of these faster growing strains in liquid YPD media at room temperature compared with the original P37005 isolate. (C) Switching analysis of faster growing isolates. White cells from each of the isolates were plated on SCD medium and grown at room temperature for 7 d. Colonies were counted and analyzed for white-to-opaque switching events. Data are combined from a minimum of three independent experiments. Error bars represent SE. **p < 0.0001 compared with SC5314-derived strains.
Figure 7.
Figure 7.
Copy number of WOR1 influences white-to-opaque switching frequencies. White cells from strains containing either one, two, or three copies of WOR1 under the control of the native promoter were plated on SCD medium and grown at room temperature for 7 d. Colonies were counted and analyzed for white-to-opaque switching events. Data are combined from a minimum of three independent experiments. Error bars represent SE. **p < 0.0001 compared with two copies of WOR1.
Figure 8.
Figure 8.
Model for stress-induced phenotypic switching. A model for how variations in cell growth affect rates of white-to-opaque switching in C. albicans. In particular, we propose that increases in cell generation times (e.g., in response to genotoxic or oxidative stress) promote white-to-opaque switching, whereas decreases in cell metabolism (including RNA and protein synthesis) inhibit white-to-opaque switching.

Similar articles

Cited by

References

    1. Abramoff M. D., Magelhaes P. J., Ram S. J. Image processing with ImageJ. Biophotonics Int. 2004;11:36–42.
    1. Acar M., Mettetal J. T., van Oudenaarden A. Stochastic switching as a survival strategy in fluctuating environments. Nat. Genet. 2008;40:471–475. - PubMed
    1. Barelle C. J., Manson C. L., MacCallum D. M., Odds F. C., Gow N. A., Brown A. J. GFP as a quantitative reporter of gene regulation in Candida albicans. Yeast. 2004;21:333–340. - PubMed
    1. Bennett R. J., Johnson A. D. Completion of a parasexual cycle in Candida albicans by induced chromosome loss in tetraploid strains. EMBO J. 2003;22:2505–2515. - PMC - PubMed
    1. Bennett R. J., Johnson A. D. Mating in Candida albicans and the search for a sexual cycle. Annu. Rev. Microbiol. 2005;59:233–255. - PubMed

Publication types