. 2009 Jul;20(14):3224-38.
doi: 10.1091/mbc.e08-12-1186. Epub 2009 May 20.

Filamin A-beta1 integrin complex tunes epithelial cell response to matrix tension

Affiliations

Filamin A-beta1 integrin complex tunes epithelial cell response to matrix tension

Scott Gehler et al. Mol Biol Cell. 2009 Jul.

Abstract

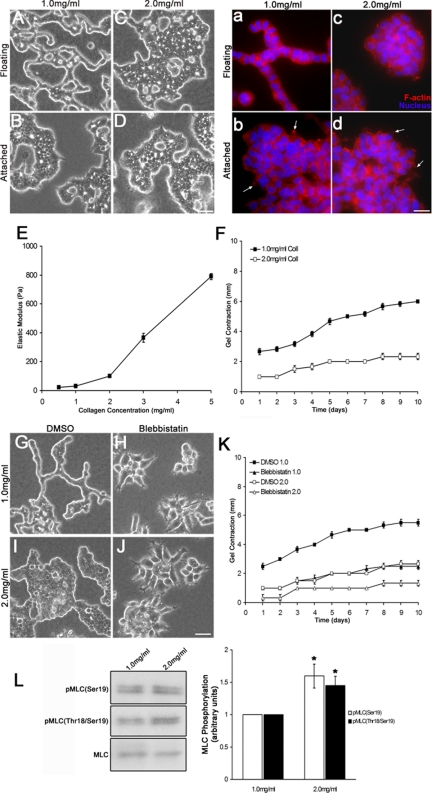
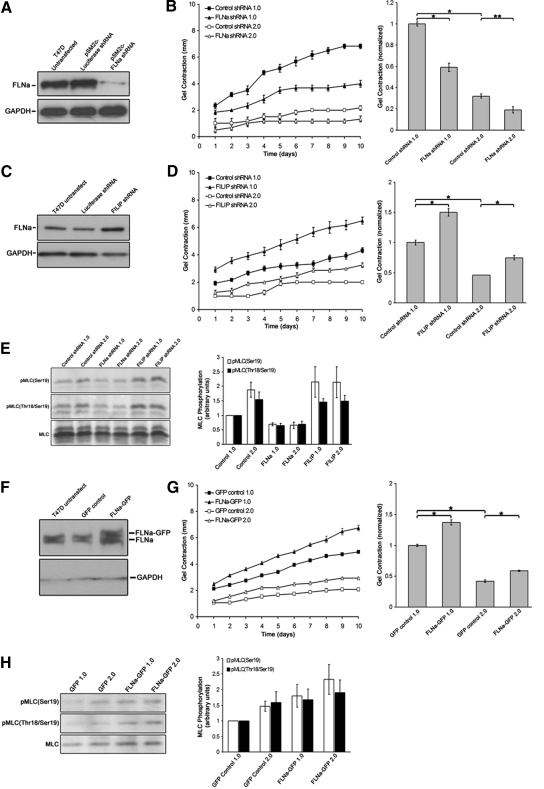
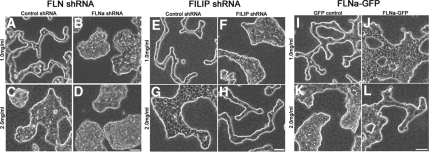
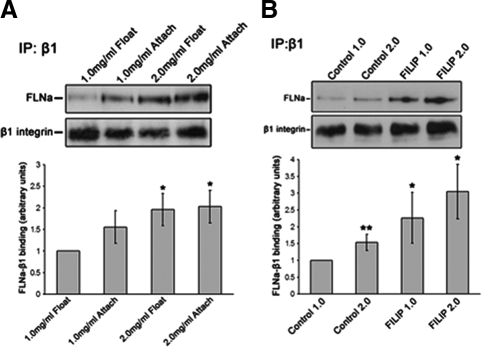
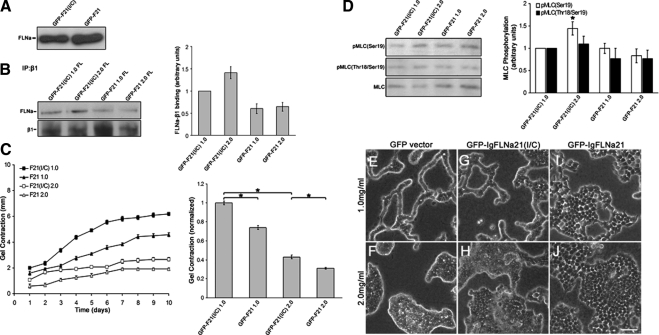
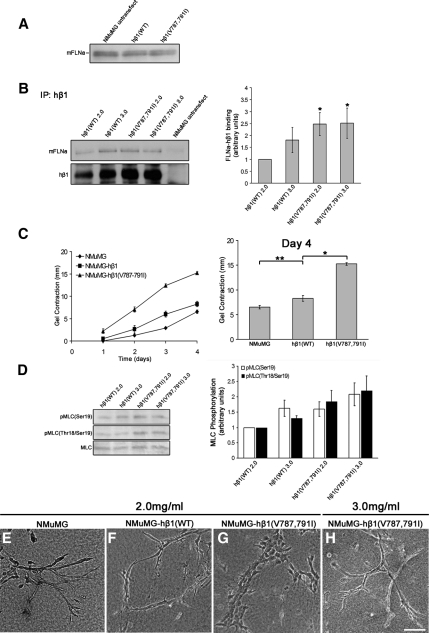
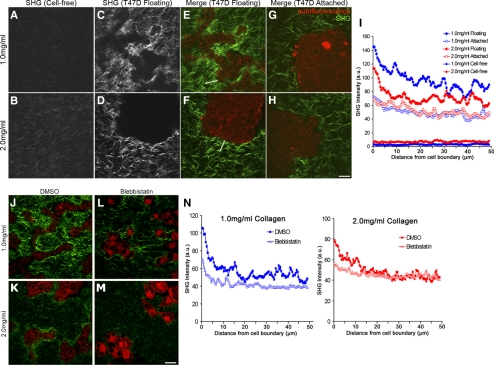
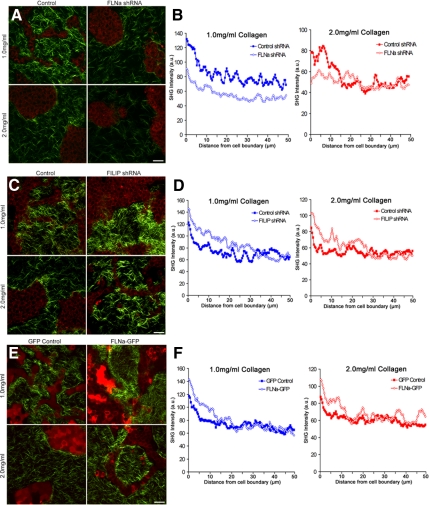
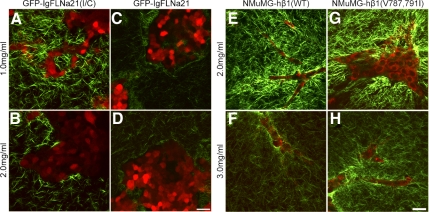
The physical properties of the extracellular matrix (ECM) regulate the behavior of several cell types; yet, mechanisms by which cells recognize and respond to changes in these properties are not clear. For example, breast epithelial cells undergo ductal morphogenesis only when cultured in a compliant collagen matrix, but not when the tension of the matrix is increased by loading collagen gels or by increasing collagen density. We report that the actin-binding protein filamin A (FLNa) is necessary for cells to contract collagen gels, and pull on collagen fibrils, which leads to collagen remodeling and morphogenesis in compliant, low-density gels. In stiffer, high-density gels, cells are not able to contract and remodel the matrix, and morphogenesis does not occur. However, increased FLNa-beta1 integrin interactions rescue gel contraction and remodeling in high-density gels, resulting in branching morphogenesis. These results suggest morphogenesis can be "tuned" by the balance between cell-generated contractility and opposing matrix stiffness. Our findings support a role for FLNa-beta1 integrin as a mechanosensitive complex that bidirectionally senses the tension of the matrix and, in turn, regulates cellular contractility and response to this matrix tension.


Figures

Figure 1.
Figure 1.
Cells must contract a compliant collagen matrix to undergo tubulogenesis. (A–D) T47D cells form tubules after 10 d when cultured in a compliant, low (1.0 mg/ml)-density floating collagen gel but not when the gel remains attached to the dish or when the collagen density is increased (2.0 mg/ml). Bar, 50 μm. (a–d) Fluorescent images of T47D cells in collagen gels labeled with AlexaFluor594 phalloidin (red) and bisbenzimide (blue). Bar, 20 μm. Cells exhibit protrusions in low- and high-density attached conditions (arrows), which is consistent with previous observations (Wozniak et al., 2003). (E) Elastic modulus (ε) of cell-free collagen gels of increasing collagen concentration, measured by rheology as described in Materials and Methods. Collagen gels of greater concentration (density) have a stiffer elastic modulus. (F) Time course of gel contraction over 10 d. High-density gels are contracted 61% less than low-density gels at day 10. Statistics were performed on the mean contraction at day 10 from six experiments and demonstrated that contraction of a 2.0-mg/ml gel was statistically less than a 1.0-mg/ml gel (data not shown; p < 0.001 by a two-sample t test). (G–J) Actomyosin contractility is important for matrix contraction in response to collagen density. Blebbistatin (20 μM) disrupted tubule formation of T47D cells in low-density floating collagen gels. Bar, 50 μm. (K) Treatment with blebbistatin caused approximately a 55 and 50% reduction in the contraction of low- and high-density floating collagen gels at day 10, respectively, relative to dimethyl sulfoxide (DMSO) control for each collagen concentration. The mean contraction at day 10 from six independent experiments showed a statistically significant decrease in collagen gel contraction when blebbistatin was added to the culture compared with control cultures (data not shown; p < 0.001 by a two-sample t test). (L) Myosin activity is enhanced in cells cultured in high-density gels, as shown through Western blot analysis of MLC phosphorylation. pMLC(Ser19) increased by ∼60%, whereas pMLC(Thr18/Ser19) was enhanced by ∼45% in response to high-density gels. Left, representative Western blot. Right, data were graphed representing the mean ± SEM for eight experiments. *p < 0.01; statistical difference relative to low-density control (two-sample t test).
Figure 2.
Figure 2.
Filamin levels control the extent of collagen gel contraction and MLC phosphorylation. (A) Stable expression of FLNa shRNA reduced FLNa in T47D cells, demonstrated by Western blot analysis. GAPDH was used as a loading control. (B) Cells expressing FLNa shRNA exhibited a 42 and 38% reduction in gel contraction by day 10 when cultured in low- or high-density gels, respectively, relative to vector control for each collagen concentration. Data are represented over 10 d and are graphed as a mean for day 10 ± SEM for six experiments. *p < 0.001, **p < 0.01 statistical difference (two-sample t test). (C) Endogenous FLNa levels were increased by stably expressing FILIP shRNA, as demonstrated by Western blot with anti-FLNa antibodies. (D) Expression of FILIP shRNA increased gel contraction over 10 d, and by day 10 there was an increase of ∼50 and 62% in low- and high-density floating gels, respectively, relative to control cells for each collagen concentration. Bar graphs represent the mean ± SEM for at least eight experiments. *p < 0.001 statistical difference (two-sample t test). (E) Perturbing FLNa levels down or up regulates myosin activity, as measured by pMLC. T47D cells expressing FLNa shRNA exhibited a 65–70% reduction in pMLC(Ser19) and pMLC(Thr18/Ser19), whereas FILIP shRNA-expressin cells exhibited a 45–115% increase in pMLC(Ser19) and pMLC(Thr18/Ser19) in both low- and high-density gels. Note that increased FLNa expression enhanced pMLC above that observed in control cells. Graphed data represent the mean ± SEM for at least six experiments. p < 0.05 for all cell types and conditions; statistical difference compared with low-density control (two-sample t test). (F) Overexpression of FLNa-GFP in T47D cells was confirmed by Western blot analysis. Expression of FLNa-GFP did not alter expression of endogenous FLNa. (G) Expression of FLNa-GFP enhances matrix contraction. FLNa-GFP enhanced gel contraction in both low and high-density floating gels, similar to FILIP shRNA. Data expressed over 10 d and graphed at day 10, representing the mean ± SEM for 15 experiments. *p < 0.001 statistical difference (two-sample t test). (H) Cells expressing FLNa-GFP exhibit increased pMLC(Ser19) and pMLC(Thr18/Ser19) levels in both low and high-density gels. Note that expression of FLNa-GFP enhanced pMLC above that observed in control cells. Graphs represent the mean from 10 experiments ± SEM p < 0.05 for all experimental conditions; statistical significance relative to low-density control (two-sample t test).
Figure 3.
Figure 3.
Filamin A levels tune tubulogenesis. (A–D) Expression of FLNa shRNA, which reduces endogenous FLNa expression, disrupted tubulogenesis in low-density floating gels (B vs. A). (E–H) Increased expression of endogenous FLNa by expressing FILIP shRNA disrupted tubulogenesis in low-density collagen gels but rescued tubulogenesis in high-density gels (H vs. G). (I–L) Expression of FLNa-GFP blocked tubule formation in low-density floating gels but rescued tubulogenesis in high-density floating gels. Bar (for all images), 50 μm.
Figure 4.
Figure 4.
Increased collagen density regulates FLNa-β1 integrin interactions. (A) Coimmunoprecipitation (IP) of T47D cells cultured in low- or high-density collagen gels. Cells in high-density gels exhibited a 96 and 103% increase compared with cells in low-density gels in FLNa binding to β1 integrin in floating or attached gels, respectively. Graphed data represent the mean ± SEM for five experiments. (B) Overexpression of FLNa by using FILIP shRNA increased FLNa-β1 integrin interactions that were not regulated by collagen density. Although control cells displayed ∼66% increase in FLNa-β1 integrin interactions in high-density floating gels compared with low-density gels, FILIP shRNA further enhanced FLNa binding to β1 integrin by ∼160 and 240% in low- and high-density floating gels, respectively. Graphed data represent the mean ± SEM for four experiments. *p < 0.05, **p < 0.01; statistical difference relative to low-density control gels (two-sample t test). Immunoglobulin G control for IPs is found in Supplemental Figure 1.
Figure 5.
Figure 5.
Decreased FLNa-β1 integrin binding reduces collagen matrix contraction and disrupts tubule formation. To inhibit FLNa-β1 integrin interactions, the integrin-binding region of FLNa coupled to GFP (GFP-F21) was expressed in T47D cells. As a control, the same construct containing a point mutation that abolishes FLNa binding to β1 integrin, GFP-F21(I/C), was used. (A) T47D cells expressing GFP-F21(I/C) or GFP-F21 have similar levels of endogenous FLNa, demonstrating that these constructs do not alter FLNa levels. Equal numbers of cells were lysed and used for comparison of FLNa expression. (B) Coimmunoprecipitation with anti-β1 integrin antibody demonstrates that GFP-F21, which binds to β1 integrin, reduced coprecipitation of FLNa with β1 integrin, whereas GFP-F21(I/C), which does not bind β1 integrin, did not block FLNa-β1 integrin coprecipitation. Graphed data (right) represent the mean of three similar experiments quantified ± SEM, p < 0.05 for all conditions; statistical significance relative to GFP-F21(I/C) control cells in low-density collagen gels (two-sample t test). (C) Disruption of FLNa binding to β1 integrin reduces contraction of collagen gels. Compared with GFP-F21(I/C) controls, GFP-F21 cells display a 26 and 28% reduction in the contraction of low- and high-density floating gels, respectively, at day 10. Bar graph data represent the mean contraction at day 10 ± SEM from a minimum of 11 experiments. *p < 0.001 statistical difference (two-sample t test). (D) Expression of GFP-F21 blocked the density-dependent increase in both pMLC(Ser19) and pMLC(Thr18/Ser19). However, GFP-F21 did not have a significant effect on pMLC levels in low-density gels. Quantified data represent the mean ± SEM for seven experiments. *p < 0.02; statistical difference compared with control cells in low-density collagen gels (two-sample t test). (E–J) Cells expressing GFP-F21(I/C) formed tubules in low-density collagen gels and exhibited disrupted tubulogenesis in high-density floating gels, similar to GFP vector control. However, expression of GFP-F21 disrupted tubulogenesis in both low- and high-density floating gels. Bar, 50 μm.
Figure 6.
Figure 6.
Increased FLNa binding to β1 integrin enhances matrix contraction and tunes branching morphogenesis. Mouse NMuMG cells were stably transfected with human β1 integrin wild-type (WT) or a β1 integrin containing two point mutations that specifically enhance binding of FLNa, hβ1(V787,791I). (A) Western blot of lysates from NMuMG cells expressing either hβ1(WT) or hβ1(V787,791I) demonstrates that these constructs did not alter levels of FLNa. Equal numbers of cells were lysed and used for comparison of mFLNa expression. (B) Cells expressing hβ1(V787,791I) cells have enhanced mFLNa binding to hβ1 integrin in both low- (2.0 mg/ml) and high (3.0 mg/ml)-density gels, whereas WT hβ1 integrin binding to mFLNa is regulated by matrix density. Immunoprecipitations (IPs) were performed with anti-hβ1 integrin antibody, the specificity of which was verified using equal numbers of untransfected NMuMG cells that do not express hβ1 integrin. Quantified data represent the mean ± SEM for four experiments. *p < 0.05; statistical difference compared with low-density control (two-sample t test). (C) Enhanced FLNa-β1 integrin interactions enhanced collagen gel contraction, shown over 4 d (left). Expression of hβ1(V787,791I) enhanced levels of gel contraction at day 4 relative to both hβ1(WT) and untransfected cells (right). Data are mean ± SEM from a minimum of eight experiments. *p < 0.001, **p < 0.05 statistical difference (two-sample t test). (D) Expression of hβ1(V787,791I) enhanced pMLC(Ser19) and pMLC(Thr18-Ser19) in both low- and high-density collagen gels. Quantified data represent the mean ± SEM for five experiments. p < 0.05 for all conditions; statistical significance relative to low-density hβ1 integrin control (two-sample t test). (E–H) Increased FLNa binding to β1 integrin tunes branching morphogenesis in high-density gels. Although NMuMG-hβ1(WT) cells exhibited a branched phenotype in low (2.0 mg/ml)-density gels (F), hβ1(V787–791I) cells exhibited disrupted morphogenesis in low-density gels (G). However, increasing the collagen density to 3.0 mg/ml was sufficient for hβ1(V787-791I) cells to undergo branching morphogenesis (H). Bar, 100 μm.
Figure 7.
Figure 7.
Establishment of a quantitative assay demonstrates that collagen gel remodeling occurs via contractility. Representative SHG images of low (1.0 mg/ml) and high (2.0 mg/ml) density collagen gels showing random fibril organization of cell-free gels (A and B) compared with floating gels of the same concentration containing cells (C and D). (E–H) MPLSM/SHG merged images of collagen (green) and T47D cell autofluorescence (red) in floating and attached gels of low (1.0 mg/ml) and high (2.0 mg/ml) density. White lines in E and F are examples of a region of interest where SHG fluorescence intensity was measured along line scans and used for data presented in I. Bar, 50 μm. (I) Average SHG fluorescence intensity of collagen fibrils in low and high-density gels. Line scans 50 μm in length were drawn from the edge of the cell–ECM boundary (=0 μm) into the collagen gel and graphed as a function of distance from the edge of the cell. For empty gels, line scans of 50 μm were taken randomly throughout the image. Data represent nine images, three measurements per image, averaged. At 5 μm out from the cell boundary, statistical difference p < 0.001 (1.0 floating vs. 2.0 floating; 2.0 floating vs. 1.0 attached; 2.0 floating vs. 2.0 attached) by the two-sample t test. By regression analysis, p < 0.0001 (1.0 floating vs. 2.0 floating) for each line scan. (J–M) Representative images of collagen (green) and cell autofluorescence (red) show diminished collagen fibril condensation in both low- (1.0 mg/ml) and high (2.0 mg/ml)-density floating collagen gels in the presence of blebbistatin. Bar, 50 μm. (N) Average intensity of collagen fluorescence taken from the edge of the cell–ECM boundary (=0 μm) out 50 μm into the collagen matrix in low- and high-density gels. Data are averaged from a minimum of eight images, three measurements per image. p < 0.01 statistical difference (1.0 DMSO vs. 1.0 blebbistatin), p < 0.05 (2.0 DMSO vs. 2.0 blebbistatin) at 5 μm out by two-sample t test. By regression analysis, p < 0.0001 (1.0 vs. 1.0 + blebbistatin; and 2.0 vs. 2.0 + blebbistatin) for each line scan.
Figure 8.
Figure 8.
FLNa levels regulate collagen matrix remodeling. (A) FLNa shRNA reduces collagen fibril condensation and matrix reorganization. Collagen (green) and cell autofluorescence (red) were imaged using SHG and MPLSM, respectively. Bar, 50 μm. (B) Line scan of SHG images represented in A to quantify the fluorescence intensity taken from the edge of the cell–ECM boundary (0 μm) into the collagen matrix of low- and high-density floating gels. Data are averaged from a minimum of six images, three measurements per image. At 5 μm, statistical difference p < 0.01 (1.0 control vs. 1.0 FLNa shRNA), p < 0.05 (2.0 control vs. 2.0 FLNa shRNA)(two-sample t test) and p < 0.0001 by regression analysis. (C) FILIP shRNA enhances collagen fibril condensation. Cell autofluorescence (red) and collagen (green) were imaged using MPLSM and SHG imaging, respectively. Bar, 50 μm. (D) Average fluorescence intensity of collagen fibrils in low- and high-density floating gels. Line scans were taken from the edge of the cell–ECM boundary (0 μm) into the collagen matrix. Data are averaged from a minimum of six images, three measurements per image. p < 0.05 statistical difference at 5 μm (1.0 control vs. 1.0 FILIP shRNA; 2.0 control vs. 2.0 FILIP shRNA) (two-sample t test), and p < 0.0001 by regression analysis. (E) FLNa-GFP enhances collagen fibril condensation near cell structures. GFP-labeled cells (pseudocolored red) and collagen (green) were imaged using MPLSM and SHG imaging, respectively. Bar, 50 μm. (F) Fluorescence intensity measurements were taken from the edge of the cell–ECM boundary (0 μm) into the collagen matrix of low and high-density floating gels. Data are averaged from a minimum of eight images, three measurements per image. At 5 μm, statistical difference p < 0.05 (1.0 GFP control vs. 1.0 FLNa-GFP; 2.0 GFP control vs. 2.0 FLNa-GFP) (two-sample t test), and p < 0.0001 by regression analysis.
Figure 9.
Figure 9.
The interaction of FLNa with β1 integrin regulates collagen matrix remodeling. (A–D) GFP-F21 reduced the ability of cells to reorganize the collagen matrix, compared with control cells expressing GFP-F21(I/C). GFP-labeled cells (pseudocolored red) and collagen (green) were imaged using MPLSM and SHG imaging, respectively. Bar, 50 μm. Line scans (not shown) taken from the edge of the cell–ECM boundary from 6 images, three measurements per image demonstrated that there is a statistical difference between 1.0 GFP-F21(I/C) versus 1.0 GFP-F21, p < 0.05 by two-sample t test and by regression analysis. (E–H) FLNa binding to β1 integrin was enhanced in NMuMG cells by expression of human β1 integrin containing two point mutations that specifically enhance binding of FLNa, hβ1(V787,791I). Expression of hβ1 integrin wild type (WT) served as a control. Note that increased FLNa-β1 integrin interactions in hβ1(V787,791I) enhanced matrix remodeling compared with hβ1(WT) even in the high-density (3.0 mg/ml) collagen gel.

Comment in

  • Mol Biol Cell. 20:3169.

Similar articles

Cited by

References

    1. Adelstein R. S., Eisenberg E. Regulation and kinetics of the actin-myosin-ATP interaction. Annu. Rev. Biochem. 1980;49:921–956. - PubMed
    1. Alexander N. R., Branch K. M., Parekh A., Clark E. S., Iwueke I. C., Guelcher S. A., Weaver A. M. Extracellular matrix rigidity promotes invadopodia activity. Curr. Biol. 2008;18:1295–1299. - PMC - PubMed
    1. Bellanger J.-M., Astier C., Sarde C., Ohta Y., Stossel T. P., Debant A. The Rac1- and RhoG-specific GEF domain of Trio targets filamin to remodel cytoskeletal actin. Nat. Cell Biol. 2000;2:888–892. - PubMed
    1. Boyd N. F., Martin L. J., Stone J., Greenberg C., Minkin S., Yaffe M. J. Mammographic densities as a marker of human breast cancer risk and their use in chemoprevention. Curr. Oncol. Rep. 2001;3:314–321. - PubMed
    1. Brown E., McKee T., diTomaso E., Pluen A., Seed B., Boucher Y., Jain R. K. Dynamic imaging of collagen and its modulation in tumors in vivo using second-harmonic generation. Nat. Med. 2003;9:796–800. - PubMed

Publication types