. 2009 May 20;29(20):6449-60.
doi: 10.1523/JNEUROSCI.0708-09.2009.

Central opioid inhibition of neuroendocrine stress responses in pregnancy in the rat is induced by the neurosteroid allopregnanolone

Affiliations

Central opioid inhibition of neuroendocrine stress responses in pregnancy in the rat is induced by the neurosteroid allopregnanolone

Paula J Brunton et al. J Neurosci. .

Abstract

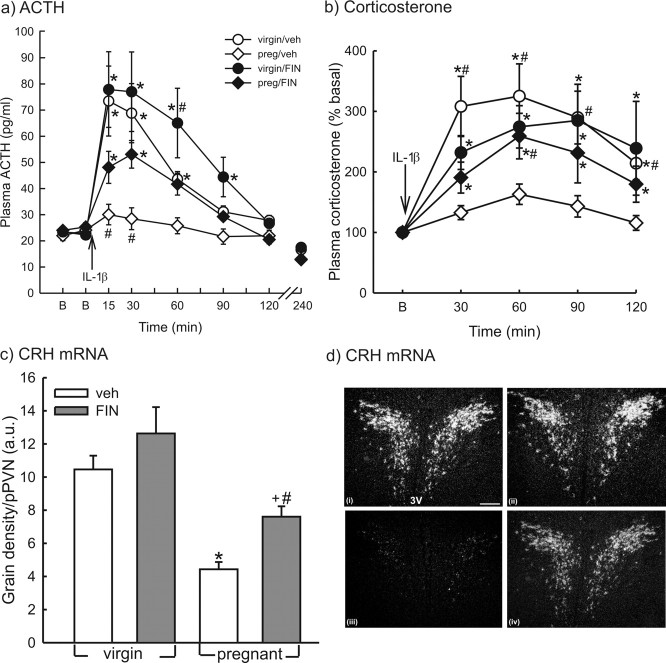
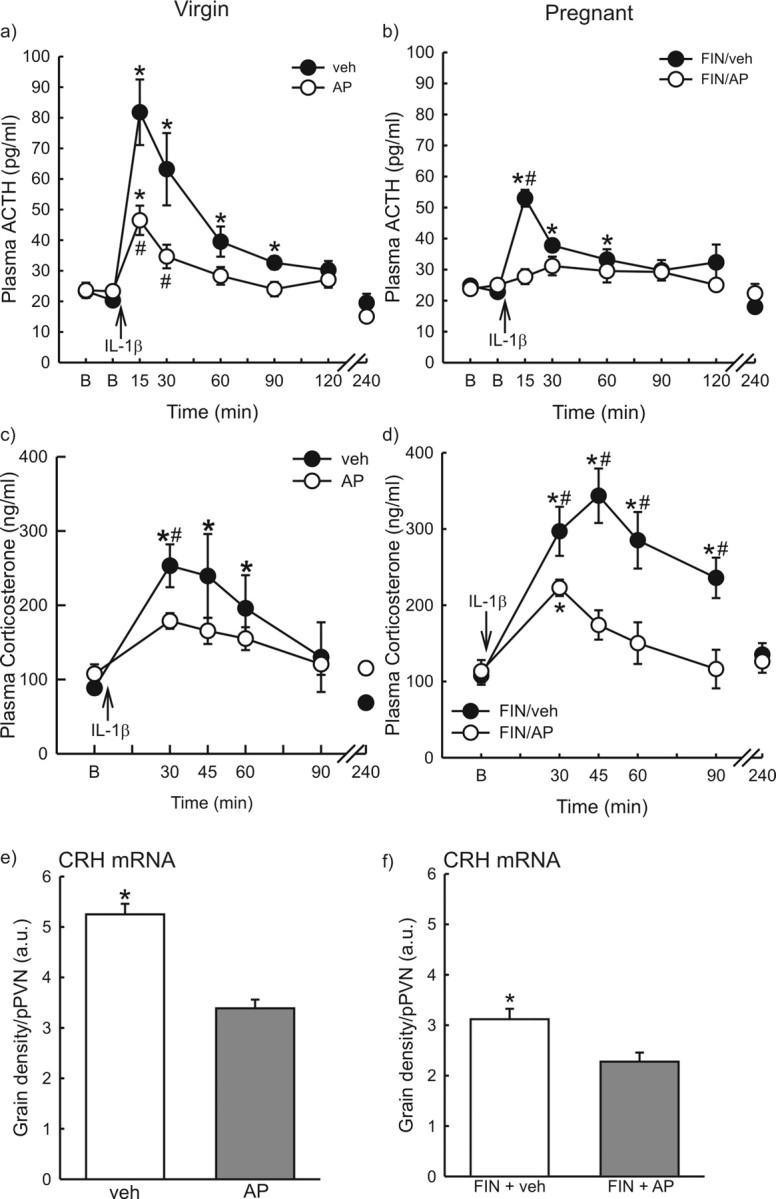
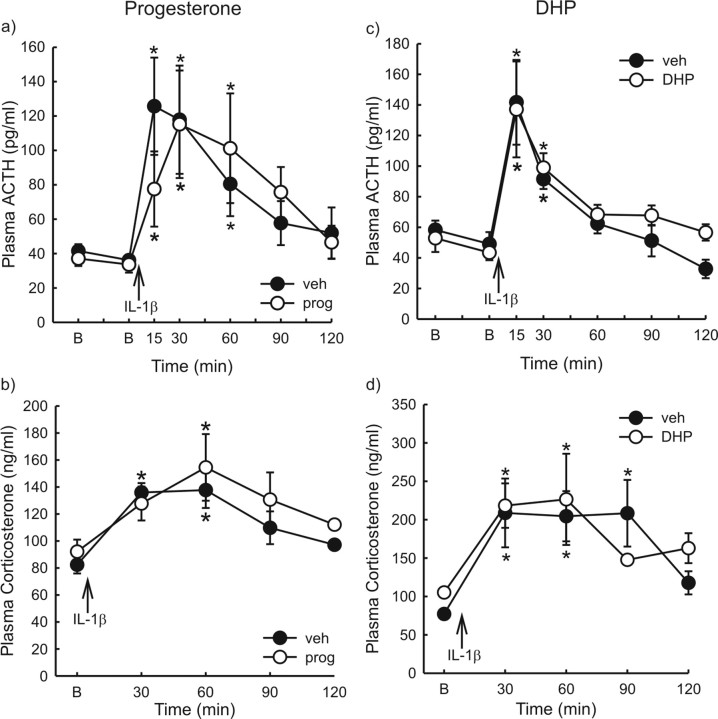
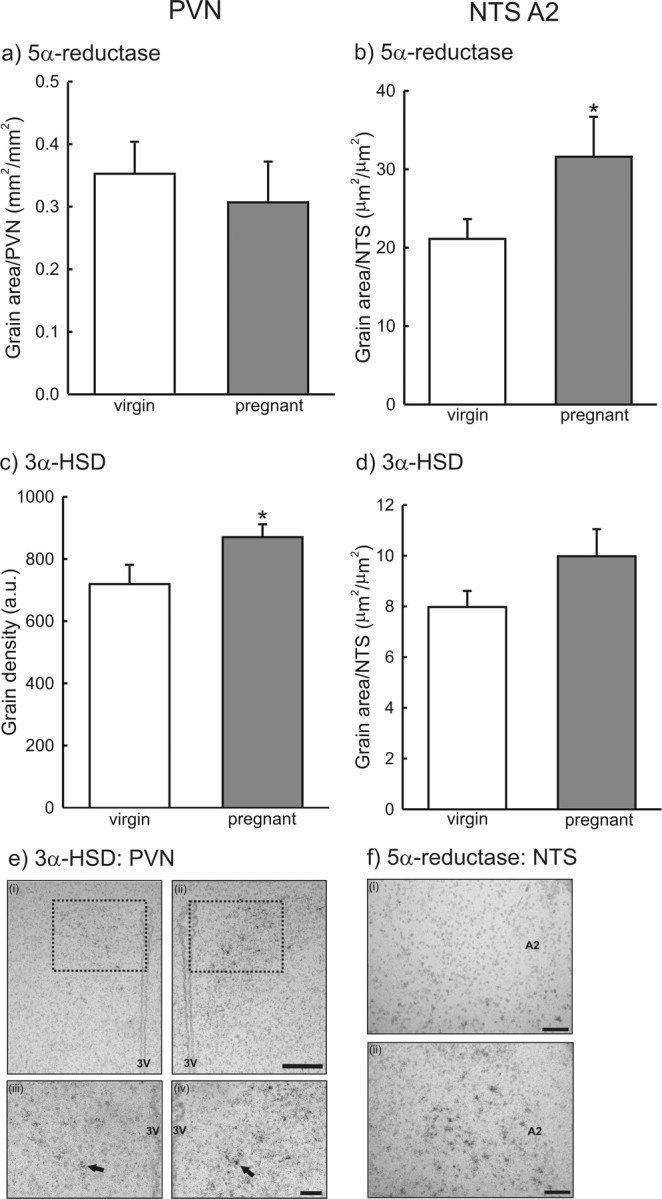
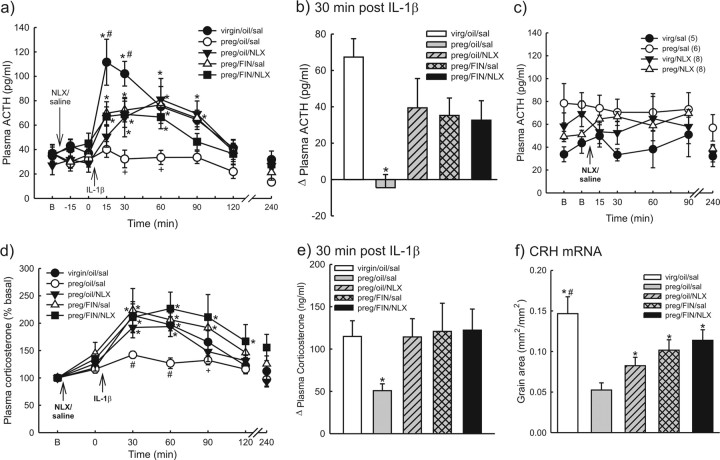
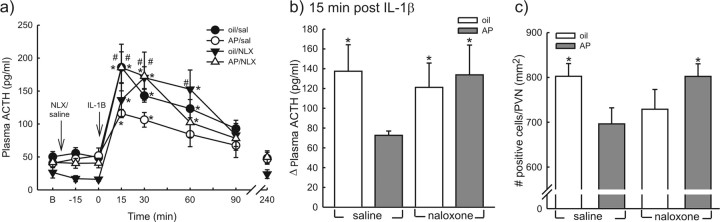
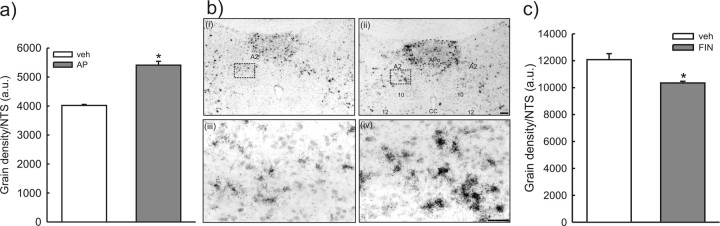
The hypothalamus-pituitary-adrenal (HPA) axis is the major neuroendocrine stress response system. Corticotropin-releasing hormone (CRH) neurons in the parvocellular paraventricular nucleus (pPVN) play a key role in coordinating responses of this system to stressors. The cytokine interleukin-1beta (IL-1beta), mimicking infection, robustly activates these CRH neurons via a noradrenergic input arising from the nucleus tractus solitarii (NTS). In late pregnancy, HPA axis responses to stressors, including IL-1beta, are attenuated by a central opioid mechanism that auto-inhibits noradrenaline release in the PVN. Here we show that the neuroactive progesterone metabolite allopregnanolone induces these changes in HPA responsiveness to IL-1beta in pregnancy. In late pregnancy, inhibition of 5alpha-reductase (an allopregnanolone-synthesizing enzyme) with finasteride restored HPA axis responses (rapidly increased pPVN CRH mRNA expression, ACTH, and corticosterone secretion) to IL-1beta. Conversely, allopregnanolone reduced HPA responses in virgin rats. In late pregnancy, activity of the allopregnanolone-synthesizing enzymes (5alpha-reductase and 3alpha-hydroxysteroid dehydrogenase) was increased in the hypothalamus as was mRNA expression in the NTS and PVN. Naloxone, an opioid antagonist, restores HPA axis responses to IL-1beta in pregnancy but had no additional effect after finasteride, indicating a causal connection between allopregnanolone and the endogenous opioid mechanism. Indeed, allopregnanolone induced opioid inhibition over HPA responses to IL-1beta in virgin rats. Furthermore, in virgin rats, allopregnanolone treatment increased, whereas in pregnant rats finasteride decreased proenkephalin-A mRNA expression in the NTS. Thus, in pregnancy, allopregnanolone induces opioid inhibition over HPA axis responses to immune challenge. This novel opioid-mediated mechanism of allopregnanolone action may alter regulation of other brain systems in pregnancy.


Figures

Figure 1.
Figure 1.
Effect of inhibiting allopregnanolone synthesis on HPA axis responses to IL-1β in virgin and pregnant rats. Virgin and day 21 pregnant (preg) rats were treated with either finasteride (FIN; 25 mg/kg, s.c.) or vehicle (veh) 20 and 2 h before IL-1β. After two basal (B) blood samples (at t = −31 and −1 min), all rats were administered IL-1β (500 ng/kg, i.v.) at t = 0 min. Additional blood samples were taken 15, 30, 60, 90, and 120 min after treatment. Trunk blood was collected at t = 240 min. n = 6–7 rats per group. a, Plasma ACTH concentration. *p < 0.03 versus basal values in the same group; #p < 0.05 versus all other groups at the same time point. b, Plasma corticosterone concentration. *p < 0.04 versus basal values in the same group; #p < 0.04 versus preg/veh group at the same time point. Rats were killed 4 h after IL-1β administration, and brains were processed by in situ hybridization. c, Quantification of CRH mRNA expression in the pPVN. CRH mRNA expression levels [expressed as arbitrary units (a.u.)] were achieved by multiplying the grain density per neuron by the number of neurons positively expressing CRH mRNA. n = 5–7 rats per group. *p < 0.001 versus virgin/veh group; #p < 0.003 versus virgin/FIN group; +p < 0.05 versus preg/veh group. Values are group means ± SEM. d, CRH mRNA: representative dark-field autoradiographs of coronal PVN sections from the following: i, virgin/vehicle; ii, virgin/FIN; iii, pregnant/vehicle; and iv, pregnant/FIN. 3V, Third ventricle. Scale bar, 200 μm.
Figure 2.
Figure 2.
Effect of allopregnanolone treatment on HPA axis responses to IL-1β. Virgin rats (a, c, e) were treated with allopregnanolone (3 and 1 mg/kg, s.c., 20 and 2 h before IL-1β, respectively) or vehicle (veh), whereas pregnant (day 20–21) rats (b, d, f) were treated with finasteride (25 mg/kg, s.c.) and either allopregnanolone (as above) or vehicle 20 and 2 h before IL-1β. After two basal (B) blood samples (at t = −31 and −1 min), all rats were administered IL-1β (500 ng/kg, i.v.) at t = 0 min. Additional blood samples were taken 15, 30, 60, 90, and 120 min after treatment. Trunk blood was collected at t = 240 min. Plasma ACTH concentrations in virgin (a) and pregnant (b) rats. c, d, Plasma corticosterone concentrations in virgin (c) and pregnant (d) rats. n = 5–7 rats per group. a, *p < 0.03 versus basal values in the same group; #p < 0.04 versus virgin/veh group; b, *p < 0.05 versus basal values in the same group; #p < 0.001 versus preg/FIN/AP group; c, d, *p < 0.001 versus basal values in the same group; #p < 0.04 versus other group at the same time point. Rats were killed 4 h after IL-1β administration, and brains were processed by in situ hybridization. e, f, Quantification of CRH mRNA expression in the pPVN in brains from virgin (e) and pregnant (f) rats. Grain density per pPVN profile [expressed as arbitrary units (a.u.)] was calculated by multiplying the mean grain density per neuron by the mean number of neurons positively expressing CRH mRNA. n = 6–9 rats per group. e, *p < 0.001 versus virgin/AP group; f, *p < 0.02 versus preg/FIN/AP group. All values are group means ± SEM.
Figure 3.
Figure 3.
Effect of progesterone or dihydroprogesterone treatment on HPA axis responses to IL-1β in virgin rats. a, b, Virgin rats were treated with either progesterone (prog; 20 and 4 mg/kg, s.c., 20 and 2 h before IL-1β, respectively) or vehicle 20 and 2 h before IL-1β. c, d, In a separate experiment, rats were treated with DHP (4 and 1 mg/kg, s.c., 20 and 2 h before IL-1β, respectively) or vehicle (veh) 20 and 2 h before IL-1β. After two basal blood samples (B; at t = −31 and −1 min), all rats were administered IL-1β (500 ng/kg, i.v.), and additional blood samples were withdrawn 15, 30, 60, 90, and 120 min after treatment. n = 5–8 rats per group. Values are group means ± SEM. Plasma ACTH concentration (a) and plasma corticosterone concentration (b) before and after systemic IL-1β in vehicle- and progesterone-treated virgin rats. Plasma ACTH concentration (c) and plasma corticosterone concentration (d) before and after systemic IL-1β in vehicle- and DHP-treated virgin rats. *p < 0.05 versus basal.
Figure 4.
Figure 4.
Central expression of mRNA for the progesterone converting enzymes in late pregnancy. Virgin and day 21 pregnant rats were killed by conscious decapitation, and brains were processed by in situ hybridization using 35S-labeled riboprobes complementary to rat 5α-reductase mRNA and rat 3α-HSD mRNA. a, b, Quantification of 5α-reductase mRNA expression in the PVN (a) and 5α-reductase mRNA expression in the A2 region of the NTS (b). Data are expressed as the grain area per PVN (mm2/mm2) or NTS (μm2/μm2) profile. *p < 0.05 versus virgin group. c, d, Quantification of 3α-HSD mRNA in the PVN (c) and 3α-HSD mRNA expression in the A2 region of the NTS (d). Data are expressed either as mean grain density/PVN [expressed as arbitrary units (a.u.); the mean grain density per neuron times number of neurons positively expressing 3α-HSD mRNA) or as grain area per NTS profile (μm2/μm2).] *p < 0.05 versus virgin group. n = 5–6 rats per group. All values are group means ± SEM. e, Representative photomicrographs of 3α-HSD mRNA expression in the PVN of virgin (i) and pregnant (ii) rats. Higher-magnification views of the areas indicated by the dashed box are shown from virgin (iii) and pregnant (iv) rats. 3V, Third ventricle. Scale bars: top, 200 μm; bottom, 100 μm. Filled arrows indicate positive cells. f, Representative photomicrographs of 5α-reductase mRNA expression in the A2 region of the NTS from virgin (i) and pregnant (ii) rats. Scale bar, 100 μm.
Figure 5.
Figure 5.
Effect of inhibiting allopregnanolone synthesis and endogenous opioid action on HPA axis responses to IL-1β in late pregnancy. Day 21 pregnant (preg) rats were treated with either finasteride (FIN; 25 mg/kg, s.c.) or vehicle (oil) 20 and 2 h before IL-1β. After a basal (B) blood sample (at t = −31 min), rats were administered naloxone (NLX; 5 mg/kg, i.v.) or vehicle [saline (sal); 0.5 ml/kg, i.v.]. Two additional blood samples were collected at −16 and −1 min, after which all rats were administered IL-1β (500 ng/kg, i.v.) at t = 0 min. Additional blood samples were taken 15, 30, 60, 90, and 120 min after treatment. Trunk blood was collected at t = 240 min. A group of virgin rats pretreated with vehicle (oil) and then saline before IL-1β administration was included for comparison. a, b, Plasma ACTH concentration (a) and increase in ACTH secretion (b) from basal levels 30 min after IL-1β. c, Plasma ACTH concentration in a separate group of virgin and day 21 pregnant (preg) rats before and after treatment only with naloxone (NLX; 5 mg/kg, i.v.) or saline (0.5 ml/kg, i.v.) administration. No significant differences within or between groups were detected. d, e, Plasma corticosterone concentration (d) and increase in corticosterone secretion (e) from basal levels 30 min after IL-1β from the same rats shown in a and b. n = 6–7 rats per group. a, *p < 0.04 versus basal values in the same group; #p < 0.04, +p < 0.007 versus all other groups at the same time point; b, *p < 0.001 versus all other groups; d, *p < 0.009 versus basal values in the same group; #p < 0.008 versus all other groups at the same time point; +p < 0.02 versus preg/FIN/NLX group. e, *p < 0.05 versus all other groups. Rats were killed 4 h after IL-1β administration, and brains were processed by in situ hybridization. f, Quantification of CRH mRNA expression in the pPVN. n = 6–8 rats per group. f, *p < 0.05, #p < 0.001 versus preg/oil/saline group. All values are group means ± SEM.
Figure 6.
Figure 6.
Effect of allopregnanolone treatment on induction of inhibitory opioid tone over HPA axis responses to IL-1β in virgin rats. Virgin rats were treated with allopregnanolone (3 and 1 mg/kg, s.c., 20 and 2 h before IL-1β, respectively) or vehicle (oil). After a basal (B) blood sample (at t = −31 min), rats were administered naloxone (NLX; 5 mg/kg, i.v.) or vehicle [saline (sal); 0.5 ml/kg, i.v.]. Two additional blood samples were collected at −16 and −1 min, after which all rats were administered IL-1β (500 ng/kg, i.v.) at t = 0 min. Additional blood samples were taken 15, 30, 60, 90, and 120 min after treatment. Trunk blood was collected at t = 240 min. a, b, Plasma ACTH concentration (a) and increase in ACTH secretion (b) from post-naloxone levels 15 min after IL-1β. n = 8–10 rats per group. a, *p < 0.05 versus basal values in the same group; #p < 0.04 versus AP/sal group; b, *p < 0.05 versus AP/sal group. Rats were killed 4 h after IL-1β administration, and brains were processed by in situ hybridization. c, CRH mRNA expression in the pPVN. Quantification by in situ hybridization 4 h after intravenous IL-1β, expressed as number of neurons expressing CRH mRNA per unit area pPVN. n = 8–13 rats per group. *p < 0.04 versus AP/saline group. All values are group means ± SEM.
Figure 7.
Figure 7.
Effect of allopregnanolone and finasteride on opioid mRNA expression in NTS. a, pENK-A mRNA expression in the A2 region of the NTS in virgin rats treated with AP (3 and 1 mg/kg, s.c.) or vehicle (veh) at t = −20 and −2 h. Brains were collected at t = 0 h. *p < 0.001 versus vehicle group. Grain density per NTS [in arbitrary units (a.u.)] is the number of positive cells per NTS section times grain density per cell. b, Representative photomicrographs of pENK-A mRNA in the A2 region of the NTS from vehicle-treated virgin (i) and AP-treated virgin (ii) rats. APo, Area postrema; CC, central canal; 10, dorsal motor nucleus of vagus; 12, hypoglossal nucleus. Scale bars: top, 100 μm; bottom, 25 μm. Vehicle-treated virgin (iii) and AP-treated virgin (iv) rats; higher-magnification views are indicated by the dashed box. c, pENK-A mRNA expression in the A2 region of the NTS in day 21 pregnant rats treated with finasteride (FIN; 25 mg/kg, s.c.) or vehicle (veh) at t = −20 and −2 h. Brains were collected at t = 0 h. *p < 0.01 versus veh group. Grain density was calculated as above. n = 5–7 rats per group. All values are group means ± SEM.

Similar articles

Cited by

References

    1. Agís-Balboa RC, Pinna G, Zhubi A, Maloku E, Veldic M, Costa E, Guidotti A. Characterization of brain neurons that express enzymes mediating neurosteroid biosynthesis. Proc Natl Acad Sci U S A. 2006;103:14602–14607. - PMC - PubMed
    1. Bailey TW, Appleyard SM, Jin YH, Andresen MC. Organization and properties of GABAergic neurons in solitary tract nucleus (NTS) J Neurophysiol. 2008;99:1712–1722. - PubMed
    1. Bali B, Kovács KJ. GABAergic control of neuropeptide gene expression in parvocellular neurons of the hypothalamic paraventricular nucleus. Eur J Neurosci. 2003;18:1518–1526. - PubMed
    1. Beaulieu J, Champagne D, Drolet G. Enkephalin innervation of the paraventricular nucleus of the hypothalamus: distribution of fibers and origins of input. J Chem Neuroanat. 1996;10:79–92. - PubMed
    1. Bertics SJ, Bertics PJ, Clarke JL, Karavolas HJ. Distribution and ovarian control of progestin-metabolizing enzymes in various rat hypothalamic regions. J Steroid Biochem. 1987;26:321–328. - PubMed

Publication types

MeSH terms

LinkOut - more resources