. 2009 May 20;29(20):6580-92.
doi: 10.1523/JNEUROSCI.0525-09.2009.

Multisensory integration in the superior colliculus requires synergy among corticocollicular inputs

Affiliations

Multisensory integration in the superior colliculus requires synergy among corticocollicular inputs

Juan Carlos Alvarado et al. J Neurosci. .

Abstract

Influences from the visual (AEV), auditory (FAES), and somatosensory (SIV) divisions of the cat anterior ectosylvian sulcus (AES) play a critical role in rendering superior colliculus (SC) neurons capable of multisensory integration. However, it is not known whether this is accomplished via their independent sensory-specific action or via some cross-modal cooperative action that emerges as a consequence of their convergence on SC neurons. Using visual-auditory SC neurons as a model, we examined how selective and combined deactivation of FAES and AEV affected SC multisensory (visual-auditory) and unisensory (visual-visual) integration capabilities. As noted earlier, multisensory integration yielded SC responses that were significantly greater than those evoked by the most effective individual component stimulus. This multisensory "response enhancement" was more evident when the component stimuli were weakly effective. Conversely, unisensory integration was dominated by the lack of response enhancement. During cryogenic deactivation of FAES and/or AEV, the unisensory responses of SC neurons were only modestly affected; however, their multisensory response enhancement showed a significant downward shift and was eliminated. The shift was similar in magnitude for deactivation of either AES subregion and, in general, only marginally greater when both were deactivated simultaneously. These data reveal that SC multisensory integration is dependent on the cooperative action of distinct subsets of unisensory corticofugal afferents, afferents whose sensory combination matches the multisensory profile of their midbrain target neurons, and whose functional synergy is specific to rendering SC neurons capable of synthesizing information from those particular senses.


Figures
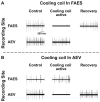
Figure 1.
Figure 1.
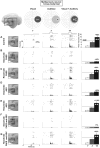
Area-specific cryogenic deactivation of FAES and AEV. The figure demonstrates the selective effects of deactivating FAES (A) or AEV (B) subregions. The examples show spontaneous and evoked neuronal activity in response to repeated auditory (A) and visual (B) stimuli for neurons recorded in FAES (A) and AEV (B). The effects of cryogenic blockade (cooling coil active) were subregion specific; evoked and spontaneous activities were eliminated within the deactivated subregion but neuronal activity in the adjacent subregion was unaffected. Neural activity was restored by cortical rewarming (Recovery in A and B).
Figure 2.
Figure 2.
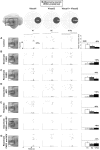
Effect of deactivating AES subregions on SC multisensory integration. Top, Depiction of the visual (dark ovoid) and auditory (light ovoid) RFs of an SC multisensory neuron. Individual deactivation coils were implanted in the auditory (FAES) and visual (AEV) subdivisions of AES cortex under physiological guidance (see Materials and Methods). The visual stimulus was a moving bar of light, and its timing is represented graphically by the ramp (“V”). The auditory stimulus was a broadband noise burst, and its timing is represented by the square pulse (“A”). Below these, the neuron's unisensory and multisensory responses are depicted as rasters, histograms, and summary bar graphs for each stimulus condition tested: control (A), deactivation of FAES (B), reactivation (C), deactivation of AEV (D), reactivation (E), deactivation of both FAES and AEV (F), and final reactivation (G). Note that in the control condition (A), there was strong multisensory response enhancement (99%**; “sum” refers to the addition of the two unisensory responses). Deactivation of either FAES (B) or AEV (D) eliminated multisensory enhancement and values were no longer significant. Simultaneous deactivation of both subregions (F) did not have a significantly greater effect on multisensory integration than did deactivation of either subregion alone. During deactivation, responses to the modality-specific stimuli were significantly reduced in a subregion-specific manner, with auditory and visual responses affected by deactivation of FAES and AEV, respectively (p < 0.05). Reactivation of FAES (C), AEV (E), or both (G) subregions restored the unisensory and multisensory responses along with multisensory enhancement. **p < 0.01.
Figure 3.
Figure 3.
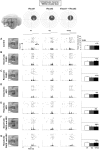
Effect of deactivating AES subregions on unisensory integration in a multisensory SC neuron. The effect of subregion deactivation on unisensory (visual–visual) integration is shown for the same neuron depicted in Figure 2. In the control condition (A), the within-modal visual stimulus pair produced a response similar in magnitude to that for the more effective of the two visual stimuli presented individually. Thus, no response enhancement was produced by the within-modal stimulus combination. Although deactivation of AEV alone (D) or together with FAES (F) diminished the sensory responses, unisensory integration varied little from the control condition. All conventions are the same as in Figure 2.
Figure 4.
Figure 4.
Effect of deactivating AES subregions on unisensory integration in a unisensory SC neuron. The characteristic effect of AES subregion deactivation on unisensory integration (visual–visual) is shown for a unisensory visual SC neuron. As in the multisensory neuron depicted in Figure 3, the within-modal visual stimulus pair failed to produce significant response enhancement (1%) in the control condition (A). Similarly, cortical deactivation of one or both (B, D, F) subdivisions did not significantly alter unisensory integration in terms of response enhancement. In contrast to that for the multisensory neuron, deactivation of AEV alone, or in combination with FAES, failed to affect the component visual responses. All conventions are the same as in Figure 2.
Figure 5.
Figure 5.
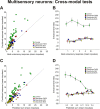
Population effects of AES subregion deactivation on multisensory enhancement. A, For each multisensory neuron, the mean response to the cross-modal stimulus combination is plotted against the mean response to the most effective modality-specific component stimulus for the control (green circles) and cortical deactivation conditions (FAES, red circles; AEV, blue circles; FAES and AEV, yellow circles). In the control condition, (green), multisensory enhancement is indicated by points falling well above the line of unity (the multisensory response exceeds the best unisensory response). During cortical deactivation of FAES, AEV, or both subregions, near complete abolition of enhancement is indicated by points that cluster near the line of unity. B, This same effect is seen when comparing the enhancement index to the best unisensory response. During deactivation of either AES subregion, or their combined deactivation, the enhancement index falls toward zero. C, The mean response to the cross-modal stimulus combination is plotted against the predicted sum of the responses to the modality-specific component stimuli. Comparison of the control (green) and deactivation (red, blue, yellow) conditions shows that many enhanced multisensory responses exceed the predicted sum (points above line of unity) during the control condition, but become clustered around or below the line of unity during deactivation of one or both AES subregions. D, Across all multisensory neurons, the enhancement index is plotted against the sum of the responses to the component unisensory. The control condition (green circles) shows that the magnitude of multisensory enhancement varies inversely with modality-specific stimulus efficacy with very strong enhancement (>150%) for weak stimuli and considerably less (<60%) for stronger stimuli. Deactivation of FAES (red circles), AEV (blue circles), or both subregions (yellow circles) renders enhancement minimal across all stimulus efficacies.
Figure 6.
Figure 6.
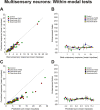
Population effects of AES subregion deactivation on unisensory integration for multisensory neurons. Shown is a summary of within-modal integration for the same population of multisensory neurons illustrated in Figure 5. All conventions are the same as in Figure 5. A, A plot of the mean combined response (visual–visual) against the mean best unisensory response shows that within-modal integration fails to yield response enhancement in the control condition (green circles). The points cluster near the line of unity, but some are below the line indicating slight suppression of the response. Cortical deactivation of FAES, AEV, or both subregions had little effect on these combined responses. B, Across the population, the enhancement index values hovered below zero when plotted against the best unisensory response for all visual stimulus efficacies and were minimally affected by cortical deactivation. C, Mean combined responses are plotted against the predicted sums and reveal within-modal interactions to produce responses that lie below the line of unity in the control condition (green). These values were unaffected by cortical deactivation of either (or both) AES subdivisions. D, The enhancement index was also below zero when plotted against the predicted sum of the two component responses.
Figure 7.
Figure 7.
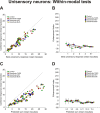
Population effects of AES subregion deactivation on unisensory integration. The same analyses shown in Figure 6 are shown here for the population of unisensory SC neurons and reveal virtually identical trends in each of the analyses. All conventions are the same as in Figure 6.
Figure 8.
Figure 8.
Population effects of subregion deactivation on multisensory and unisensory response magnitudes for multisensory and unisensory neurons. Cumulative density functions are plotted here that relate response magnitudes to combined stimuli for each of the deactivation conditions for multisensory neurons (A, B) and unisensory neurons (C). The distributions are of a simple contrast index that compares combined response magnitude after deactivation (CRD) to that in the control condition (CRC) according to the following formula: Contrast index = (CRD − CRC)/(CRD + CRC) (see Materials and Methods). A, For multisensory neurons, contrast index distributions for cross-modal stimulus combinations are shown for deactivation of FAES (red line), AEV (blue line), and both subdivisions (yellow line). All contrasts are negative indicating that deactivation reduced response magnitude relative to the control condition. Significantly greater reductions in response magnitude were observed for simultaneous deactivation of FAES and AEV (yellow line) than for either alone. B, Distributions for within-modal (visual–visual) stimulus combinations for the same multisensory neurons shown in A. Consistent with the subregion modality specificity, a reduction in response to visual–visual stimulus combinations magnitude (negative contrasts) was observed only for deactivation conditions that included AEV (blue line, yellow line). C, For unisensory neurons, contrast index distributions for within-modal stimulus combinations are centered near zero illustrating that deactivation of AEV, alone or in combination with FAES (the lines are overlapping), had no impact on the responses to visual stimulus combinations.

Similar articles

Cited by

References

    1. Alvarado JC, Stanford TR, Vaughan JW, Stein BE. Cortex mediates multisensory but not unisensory integration in superior colliculus. J Neurosci. 2007a;27:12775–12786. - PMC - PubMed
    1. Alvarado JC, Vaughan JW, Stanford TR, Stein BE. Multisensory versus unisensory integration: contrasting modes in the superior colliculus. J Neurophysiol. 2007b;97:3193–3205. - PubMed
    1. Alvarado JC, Rowland BA, Stanford TR, Stein BE. A neural network model of multisensory integration also accounts for unisensory integration in superior colliculus. Brain Res. 2008;1242:13–23. - PMC - PubMed
    1. Anastasio TJ, Patton PE, Belkacem-Boussaid K. Using Bayes' rule to model multisensory enhancement in the superior colliculus. Neural Comput. 2000;12:1165–1187. - PubMed
    1. Benedek G, Mucke L, Norita M, Albowitz B, Creutzfeldt OD. Anterior ectosylvian visual area (AEV) of the cat: physiological properties. Prog Brain Res. 1988;75:245–255. - PubMed

Publication types