. 2009 May 20;29(20):6625-34.
doi: 10.1523/JNEUROSCI.3829-08.2009.

Myosin Va increases the efficiency of neurofilament transport by decreasing the duration of long-term pauses

Affiliations

Myosin Va increases the efficiency of neurofilament transport by decreasing the duration of long-term pauses

Nael H Alami et al. J Neurosci. .

Abstract

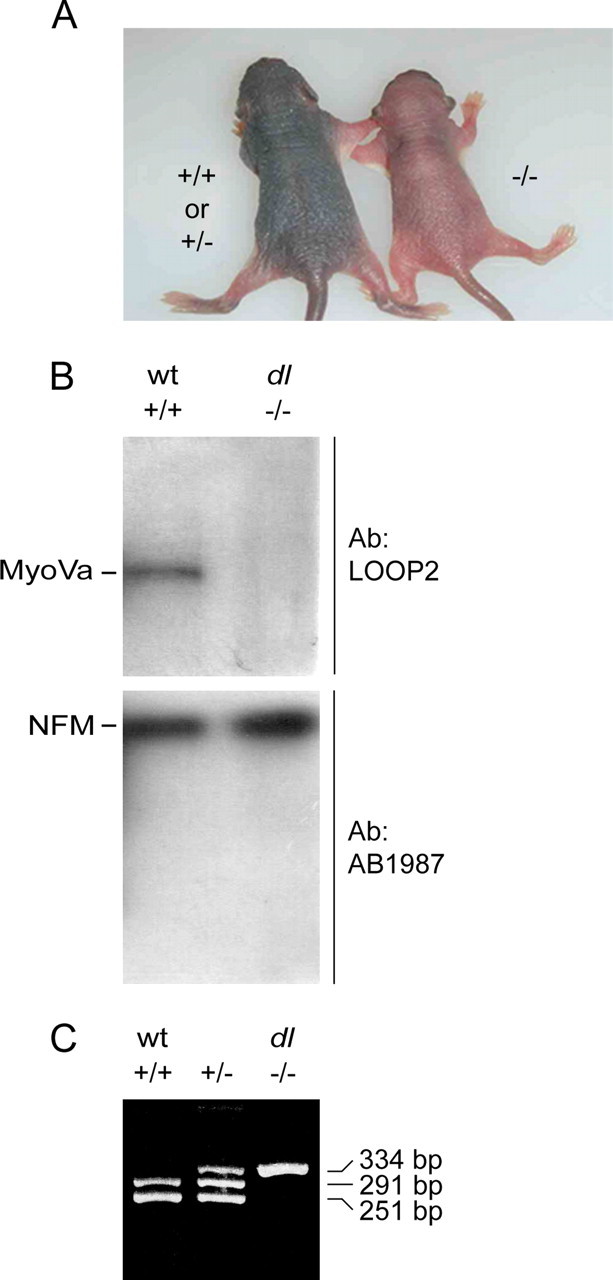
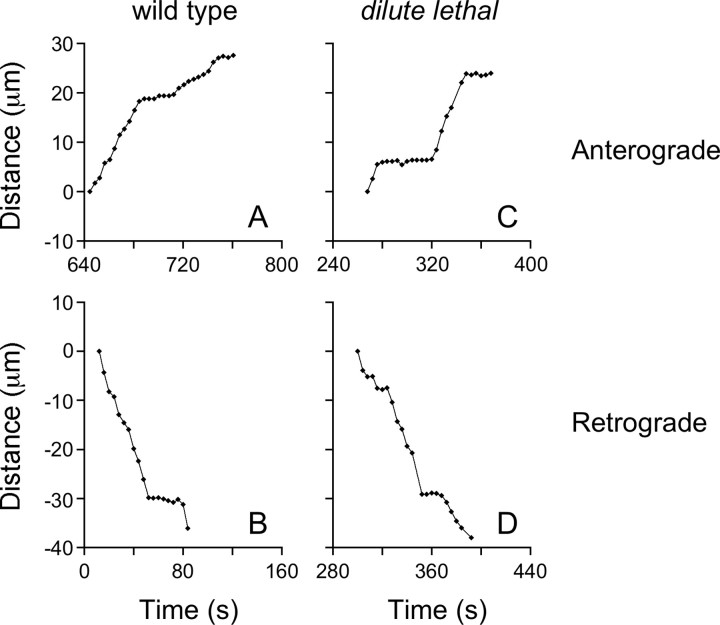
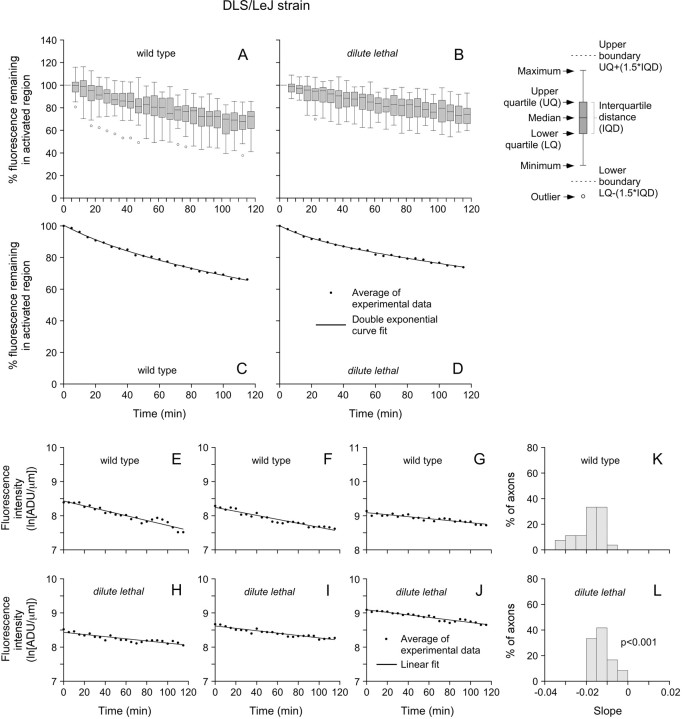
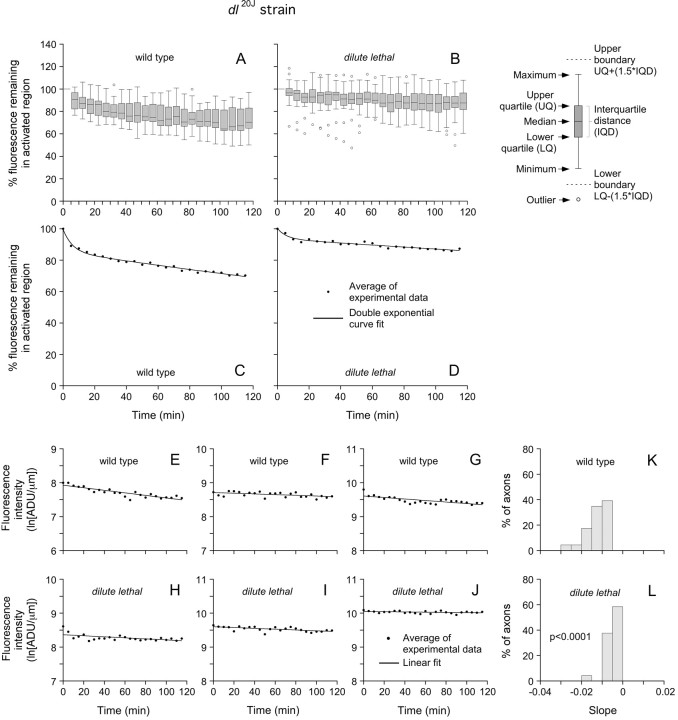
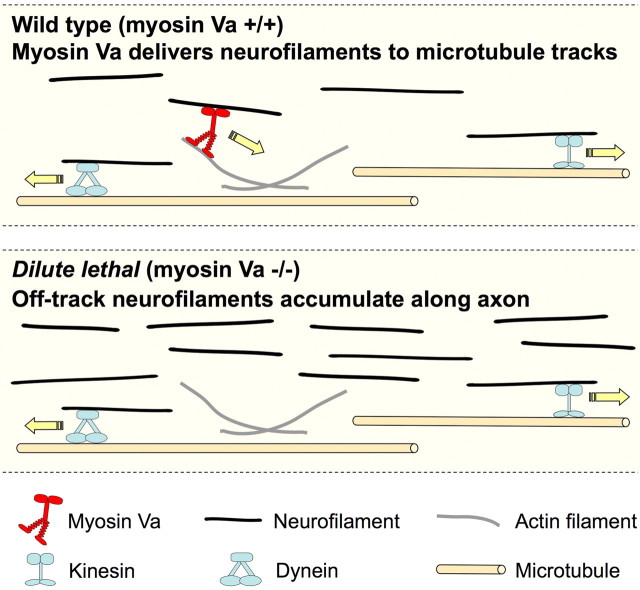
We investigated the axonal transport of neurofilaments in cultured neurons from two different strains of dilute lethal mice, which lack myosin Va. To analyze the motile behavior, we tracked the movement of green fluorescent protein (GFP)-tagged neurofilaments through naturally occurring gaps in the axonal neurofilament array of cultured superior cervical ganglion neurons from DLS/LeJ dilute lethal mice. Compared with wild-type controls, we observed no statistically significant difference in velocity or frequency of movement. To analyze the pausing behavior, we used a fluorescence photoactivation pulse-escape technique to measure the rate of departure of PAGFP (photoactivatable GFP)-tagged neurofilaments from photoactivated axonal segments in cultured dorsal root ganglion neurons from DLS/LeJ and dl20J dilute lethal mice. Compared with wild-type controls, we observed a 48% increase in the mean time for neurofilaments to depart the activated regions in neurons from DLS/LeJ mice (p < 0.001) and a 169% increase in neurons from dl20J mice (p < 0.0001). These data indicate that neurofilaments pause for more prolonged periods in the absence of myosin Va. We hypothesize that myosin Va is a short-range motor for neurofilaments and that it can function to enhance the efficiency of neurofilament transport in axons by delivering neurofilaments to their microtubule tracks, thereby reducing the duration of prolonged off-track pauses.


Figures

Figure 1.
Figure 1.
Phenotyping and genotyping dilute lethal mice. A, Two P4 DLS/LeJ mouse pups from the same litter. The dilute lethal (myoVa−/−) mice can be distinguished from their wild-type (myoVa+/+) and heterozygous (myoVa+/−) siblings based on their color. B, Western blot analysis of brain tissue from wild-type and DLS/LeJ dilute lethal mouse pups. The membrane was cut in half, and the upper part was probed with a myosin Va Ab (LOOP2), whereas the lower part was probed with an NFM Ab (AB1987) as a loading control. C, PCR genotyping of dl20J mice. Wild-type mice (myoVa+/+) were identified by the appearance of two bands at 251 and 291 bp. Mice homozygous for the dl20J allele (myoVa−/−) were identified by the appearance of one band at 334 bp. Heterozygotes (myoVa+/−) were identified by the appearance of three bands at 251, 291, and 334 bp.
Figure 2.
Figure 2.
Dilute lethal neurons extend axons that contain neurofilaments and gaps. A, B, Immunostaining of cultured SCG neurons from wild-type and DLS/LeJ dilute lethal mice, 24 h after plating. Neurofilaments were seen to extend throughout both wild-type and dilute lethal axons, with no observable difference in axon length or branching pattern. Scale bar, 20 μm. C, D, There was no apparent difference in the number or the distribution of gaps in the neurofilament array between wild-type and dilute lethal axons. Scale bar, 4 μm.
Figure 3.
Figure 3.
Examples of moving neurofilaments in wild-type and dilute lethal axons. A, B, Trajectories of two neurofilaments in wild-type axons. C, D, Trajectories of two neurofilaments in DLS/LeJ dilute lethal axons. Each point in these graphs represents the location of the neurofilament in one 4 s time interval. The x-axis represents the time elapsed since the start of the movie. The y-axis represents the distance of the neurofilament from the point in which it was first tracked, measured along the axis of the axon. Anterograde and retrograde movements are represented as positive and negative displacements, respectively. The neurofilaments in A and C moved in a net anterograde direction, whereas the neurofilaments in B and D moved in a net retrograde direction.
Figure 4.
Figure 4.
Analysis of moving neurofilaments in wild-type and dilute lethal axons. Histograms of frequency of movement (A, B), average velocities (including and excluding pauses) (C–F), and peak velocities (G, H) of neurofilaments in wild-type (n = 58) and DLS/LeJ dilute lethal (n = 53) axons. In total, we imaged 27 gaps in axons from three different batches of wild-type cultures and 21 gaps in axons from three different batches of dilute lethal cultures. The average length of the time-lapse movies was 13.3 min. Anterograde and retrograde movements are represented on the y-axis as positive and negative values, respectively. The average velocity including pauses represents the overall average for all the time intervals in which the neurofilament was tracked. Average velocity excluding pauses represents the average for only those time intervals in which the neurofilament moved. Statistical comparison of these data revealed no significant difference between wild type and dilute lethal for either direction of movement (supplemental Table 1, available at www.jneurosci.org as supplemental material).
Figure 5.
Figure 5.
A pulse–escape fluorescence photoactivation experiment. Example of a wild-type DRG neuron that was transfected with PAGFP-NFM and a diffusible red fluorescent protein (DsRed2) as a marker for transfection. A, The DsRed2 fluorescence, which fills the axon. B, A preactivation image of the same axon showing no GFP fluorescence. C, An image of the same axon immediately after activation using violet light. D, An image of the same axon 2 h later. The white arrowheads show the location of the activated region. The decrease in fluorescence between C and D is attributable to departure of fluorescent neurofilaments from the activated region, but note that many neurofilaments remain. Scale bar, 5 μm.
Figure 6.
Figure 6.
Pulse-escape kinetics for wild type and DLS/LeJ mice. A, B, Box-and-whisker plots for 27 wild-type axons and 24 DLS/LeJ dilute lethal axons that were imaged for 115 min at 5 min intervals (data normalized to the starting fluorescence intensity for each axon). The axon-to-axon variability is due in part to the stochastic nature of the movement. C, D, Plots of the average fluorescence intensities. After 115 min, the average percentage of the initial fluorescence remaining in the activated regions was 65% for the wild type and 73% for the dilute lethal. The data matches a double exponential decay (curve fit). Considering the pulse–escape kinetics to represent a probability density function, the mean time for a neurofilament to depart the activated regions was equal to 5.3 h in wild-type neurons and 7.8 h in dilute lethal neurons. E–J, Plots of the log-transformed kinetics for three representative wild-type axons and three representative dilute lethal axons. K, L, Histograms of the slopes for 27 wild-type and 24 dilute lethal neurons. The average of the slopes for the dilute lethal axons (−0.013 ln[ADU·μm−1]·min−1) was less than for the wild-type axons (−0.019 ln[ADU·μm−1]·min−1), and this difference was statistically significant (p < 0.001).
Figure 7.
Figure 7.
Pulse–escape kinetics for wild-type and dl20J mice. A, B, Box-and-whisker plots for 23 wild-type axons and 24 dl20J dilute lethal axons that were imaged for 115 min at 5 min intervals (data normalized to the starting fluorescence intensity for each axon). The axon-to-axon variability is due in part to the stochastic nature of the movement. C, D, Plots of the average fluorescence intensities. After 115 min, the average percentage of the initial fluorescence remaining in the activated regions was 69% for the wild type and 88% for the dilute lethal. The data match a double exponential decay (curve fit). Considering the pulse–escape kinetics to represent a probability density function, the mean time for a neurofilament to depart the activated regions was equal to 8.0 h in wild-type neurons and 21.6 h in dilute lethal neurons. E–J, Plots of the log-transformed kinetics for three representative wild-type axons and three representative dilute lethal axons. K, L, Histograms of the slopes for 23 wild-type and 24 dilute lethal neurons. The average of the slopes for the dilute lethal axons (−0.005 ln[ADU·μm−1]·min−1) was less than for the wild-type axons (−0.013 ln[ADU·μm−1]·min−1), and this difference was statistically significant (p < 0.0001).
Figure 8.
Figure 8.
Neurofilament phosphorylation state in wild-type and dl20J mice. A, Western blots of mouse spinal cord homogenates from wild-type (wt) and dl20J dilute lethal (dl) P4 mice. The blot membranes were cut in half, and the upper half was probed with neurofilament Ab, whereas the lower half was probed with tubulin Ab (α-tub). NFM was detected with mAb RMO270, which binds in a phospho-independent manner. Phosphorylated NFM was detected with mAb RMO55, which binds to phosphorylated epitopes on NFM in a phospho-dependent manner. NFH was detected with pAb AB1989, which binds in a phospho-independent manner. Phosphorylated NFH was detected with mouse mAbs SMI34 and RT97, which bind to phosphorylated epitopes on NFH in a phospho-dependent manner. Tubulin served as a loading control and was detected with mAb B-5-1-2. B, Quantification of blot staining intensities. Each blot was performed in triplicate. For each lane on each blot, the background-corrected intensity of the neurofilament band was divided by the background-corrected intensity of the corresponding tubulin band. For each neurofilament Ab, the resulting intensity ratios were then averaged and normalized to the average for the wild type. The error bars represent the SD about the mean. We observed no significant difference in the intensities of the bands in wild-type and dilute lethal tissue (p = 0.95 for RMO270; p = 0.67 for RMO55; p = 0.73 for AB1989; p = 0.96 for RT97; p = 0.57 for SMI34; Student's t test).
Figure 9.
Figure 9.
Hypothesis: myosin Va is a short-range motor for neurofilament transport. We speculate that myosin Va is capable of moving neurofilaments longitudinally or radially for short distances along actin filament tracks in axons. According to this hypothesis, myosin Va decreases the duration of the prolonged off-track pauses by delivering off-track neurofilaments to their microtubule tracks, thereby increasing the efficiency of neurofilament transport. In the absence of myosin Va, off-track neurofilaments may become stranded away from their microtubule tracks for longer periods of time, and on-track neurofilaments that disengage from their tracks may take longer to re-engage. This would lead to neurofilament accumulation along the axons, which could explain the increase in neurofilament number in axons of dilute lethal mice reported by Nixon and colleagues (Rao et al., 2002a).

References

    1. Ackerley S, Grierson AJ, Brownlees J, Thornhill P, Anderton BH, Leigh PN, Shaw CE, Miller CC. Glutamate slows axonal transport of neurofilaments in transfected neurons. J Cell Biol. 2000;150:165–176. - PMC - PubMed
    1. Ackerley S, Thornhill P, Grierson AJ, Brownlees J, Anderton BH, Leigh PN, Shaw CE, Miller CC. Neurofilament heavy chain side arm phosphorylation regulates axonal transport of neurofilaments. J Cell Biol. 2003;161:489–495. - PMC - PubMed
    1. Archer DR, Watson DF, Griffin JW. Phosphorylation-dependent immunoreactivity of neurofilaments and the rate of slow axonal transport in the central and peripheral axons of the rat dorsal root ganglion. J Neurochem. 1994;62:1119–1125. - PubMed
    1. Bearer EL, Reese TS. Association of actin filaments with axonal microtubule tracts. J Neurocytol. 1999;28:85–98. - PMC - PubMed
    1. Bridgman PC. Myosin Va movements in normal and dilute-lethal axons provide support for a dual filament motor complex. J Cell Biol. 1999;146:1045–1060. - PMC - PubMed

Publication types

MeSH terms

LinkOut - more resources