. 2009 May 20;29(20):6734-51.
doi: 10.1523/JNEUROSCI.1350-09.2009.

Awake intranasal insulin delivery modifies protein complexes and alters memory, anxiety, and olfactory behaviors

Affiliations

Awake intranasal insulin delivery modifies protein complexes and alters memory, anxiety, and olfactory behaviors

David R Marks et al. J Neurosci. .

Abstract

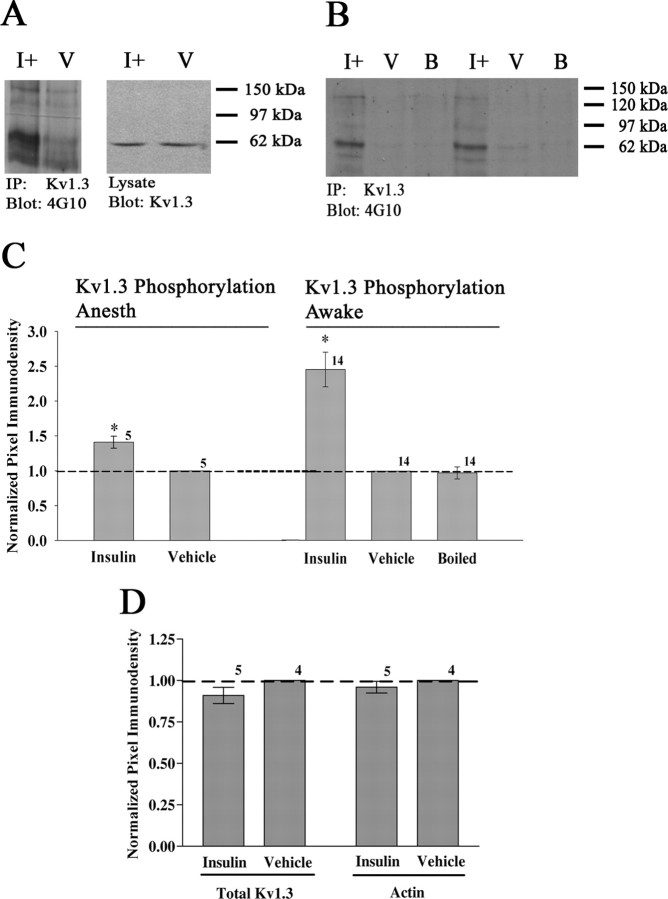
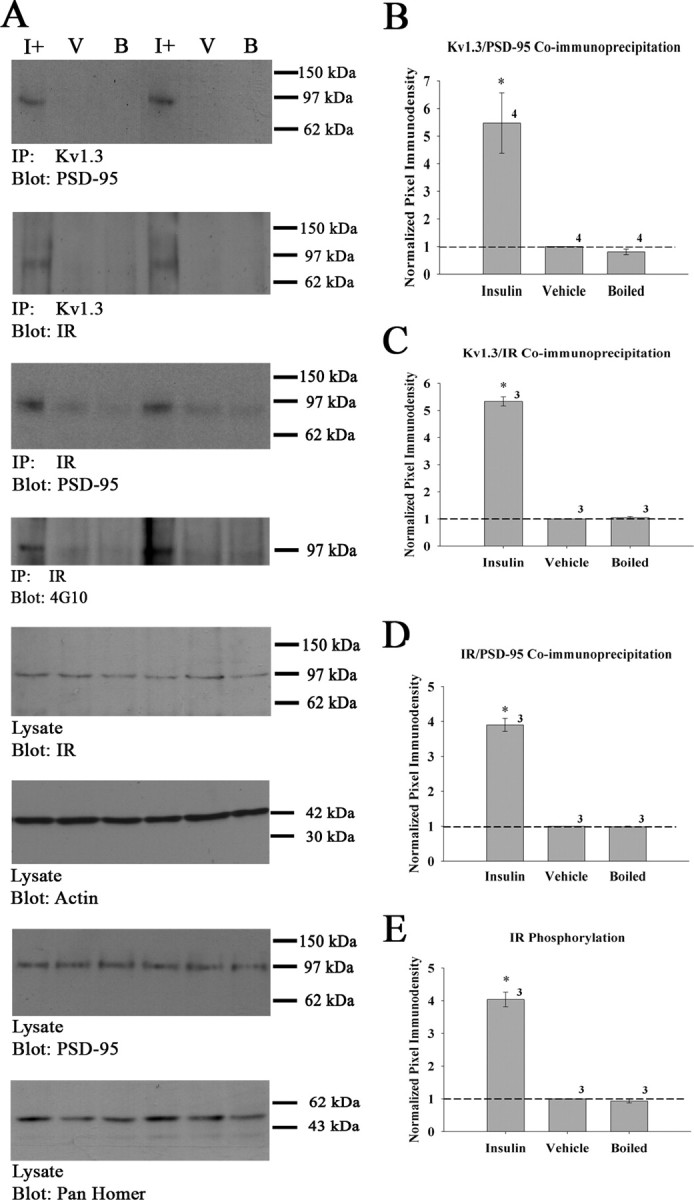
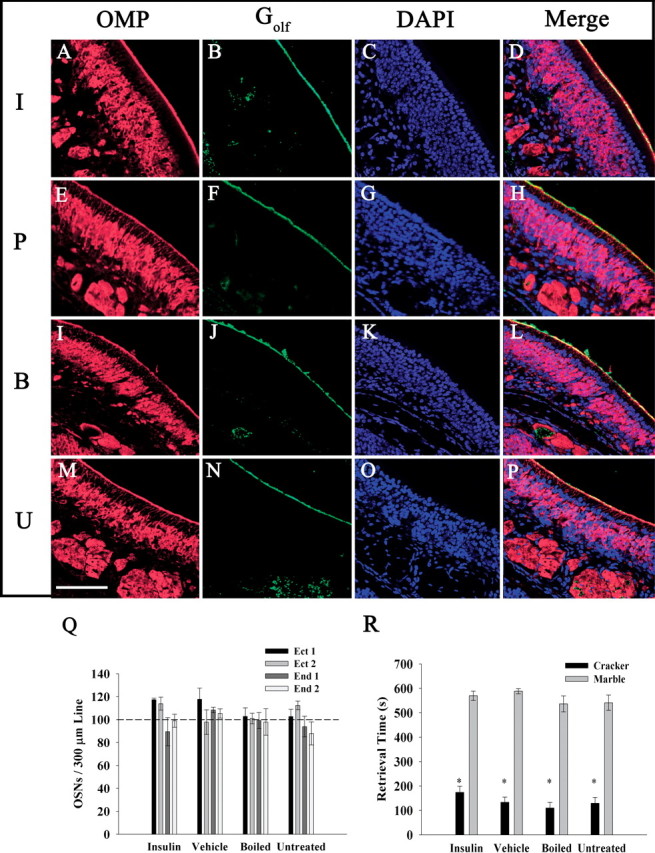
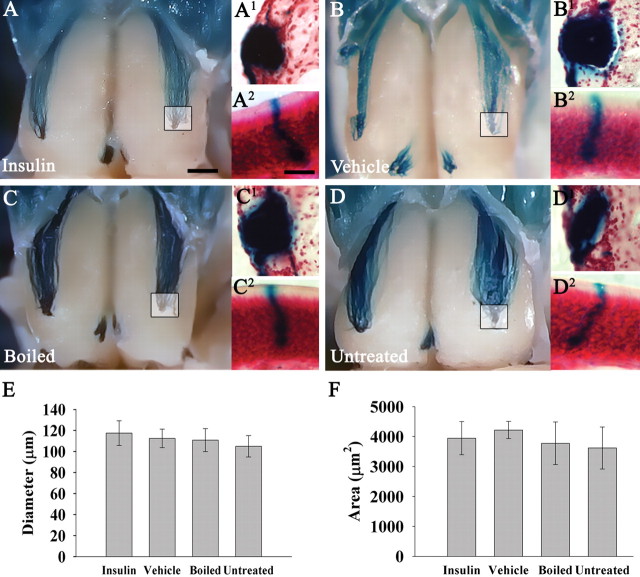
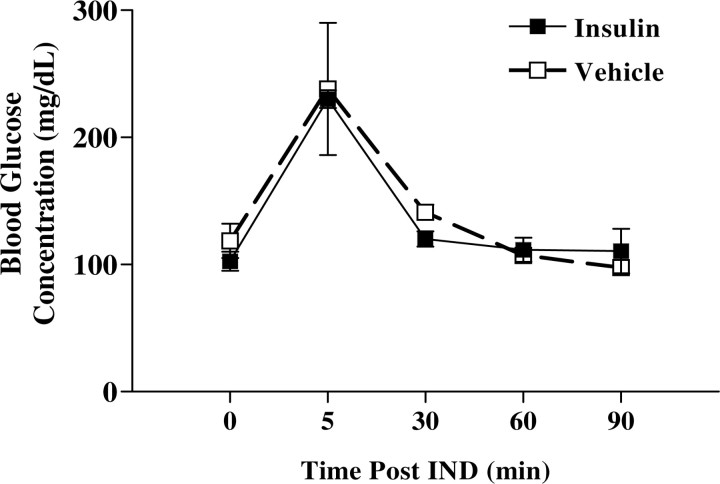
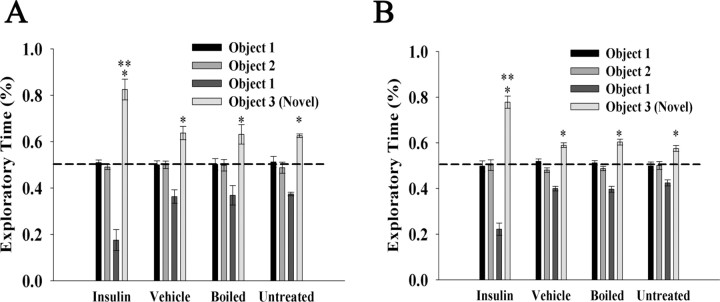
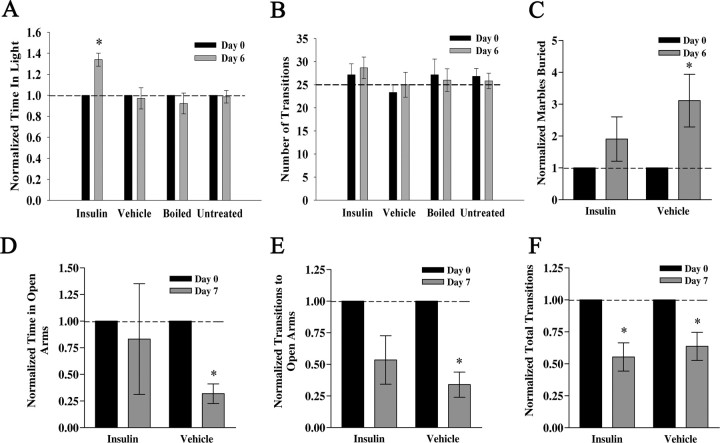
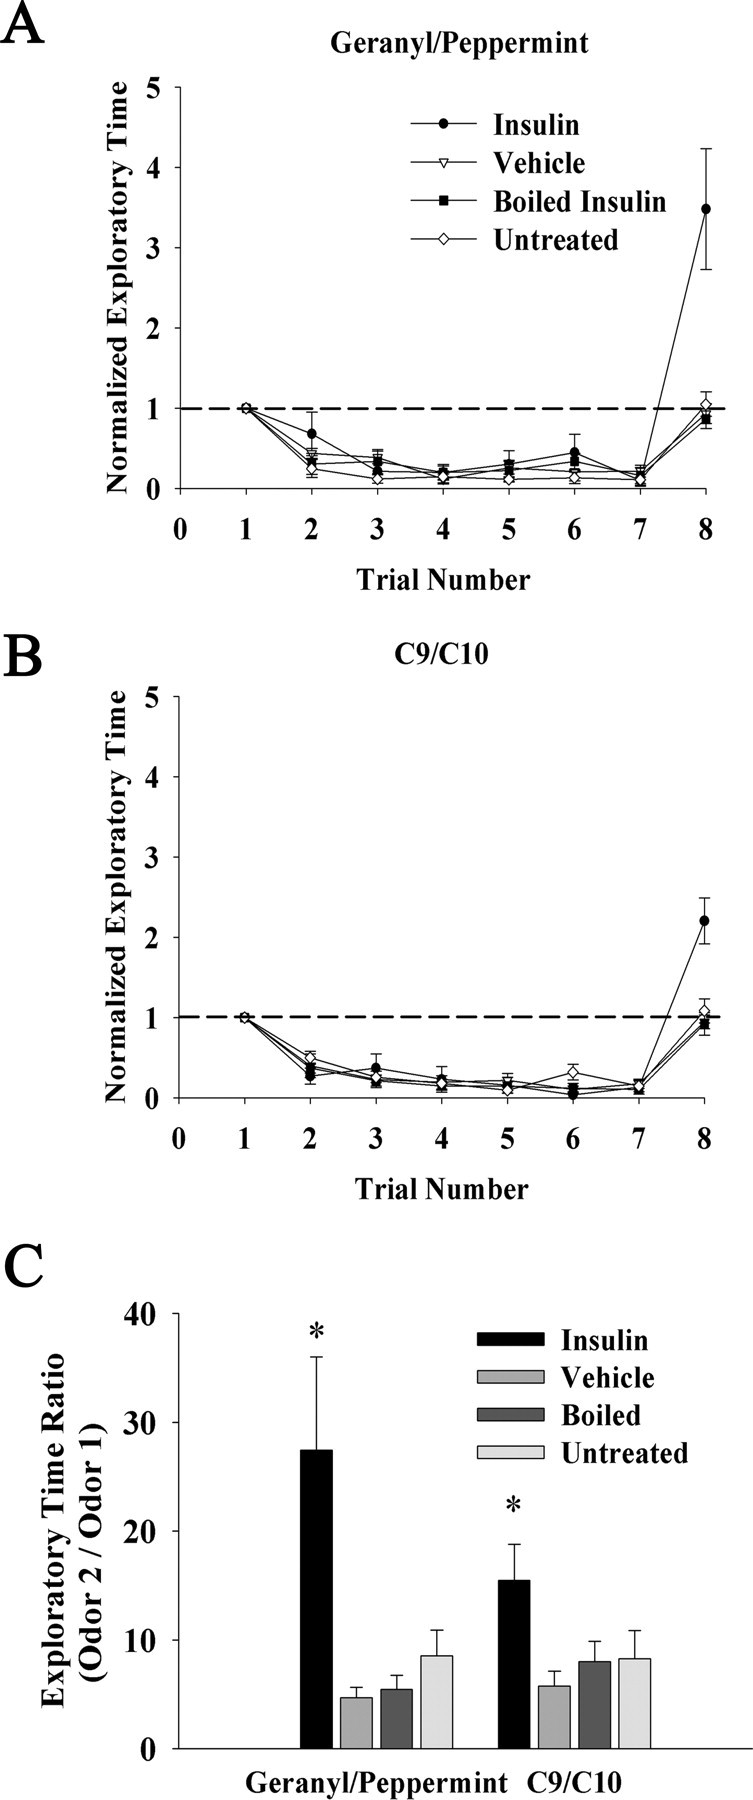
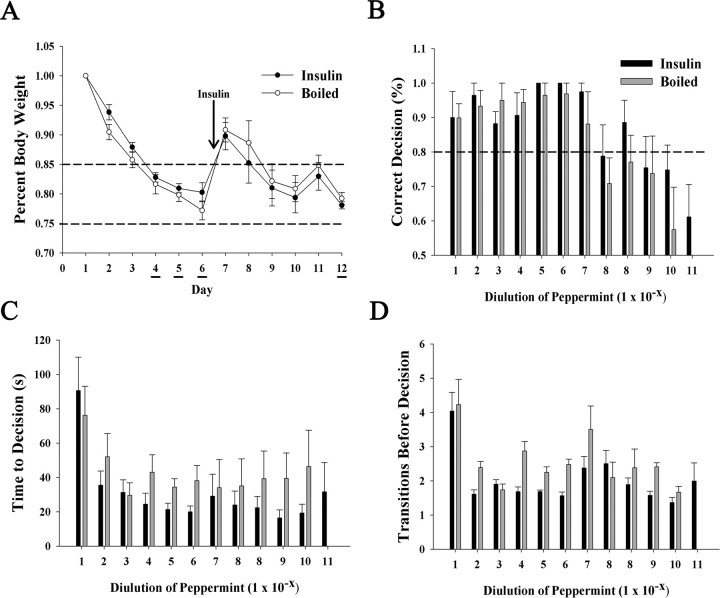
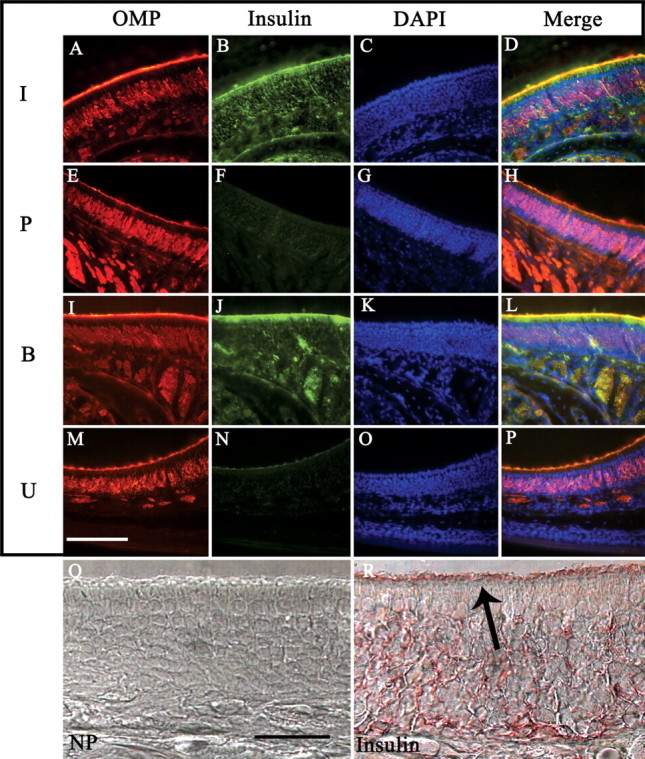
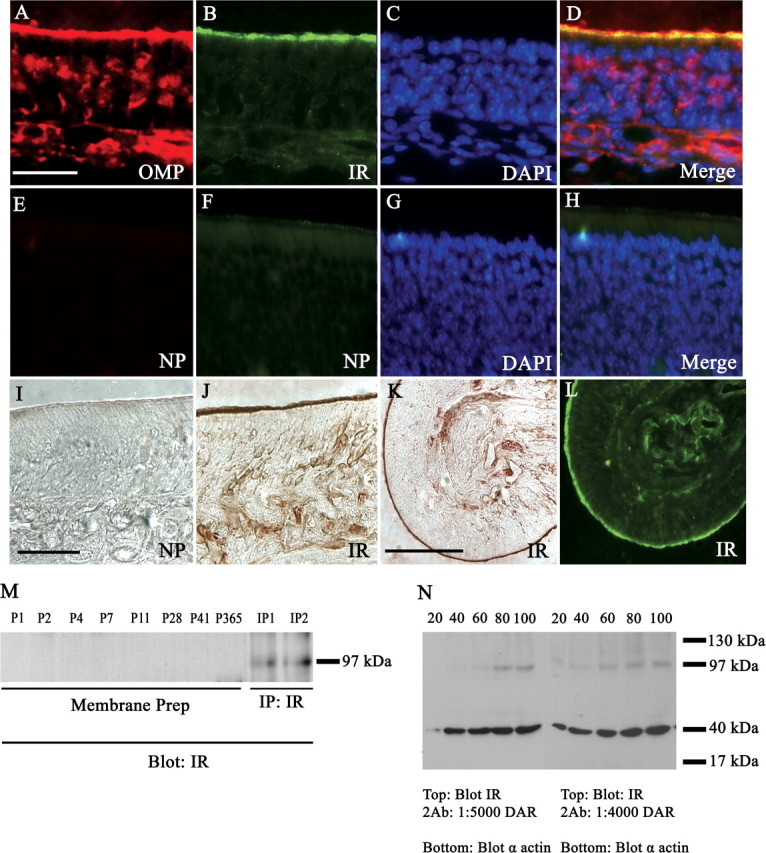
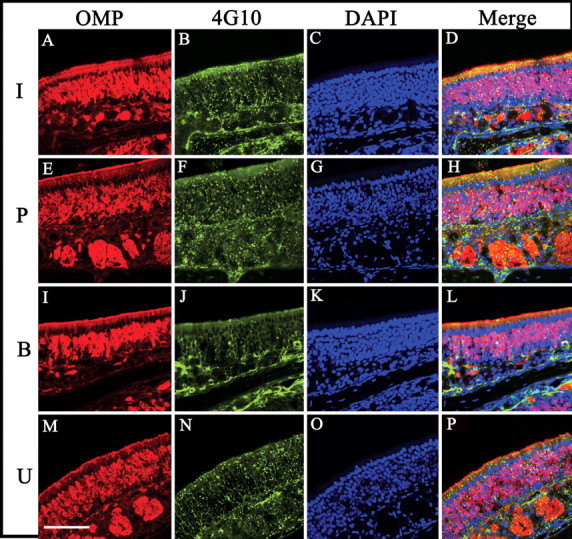
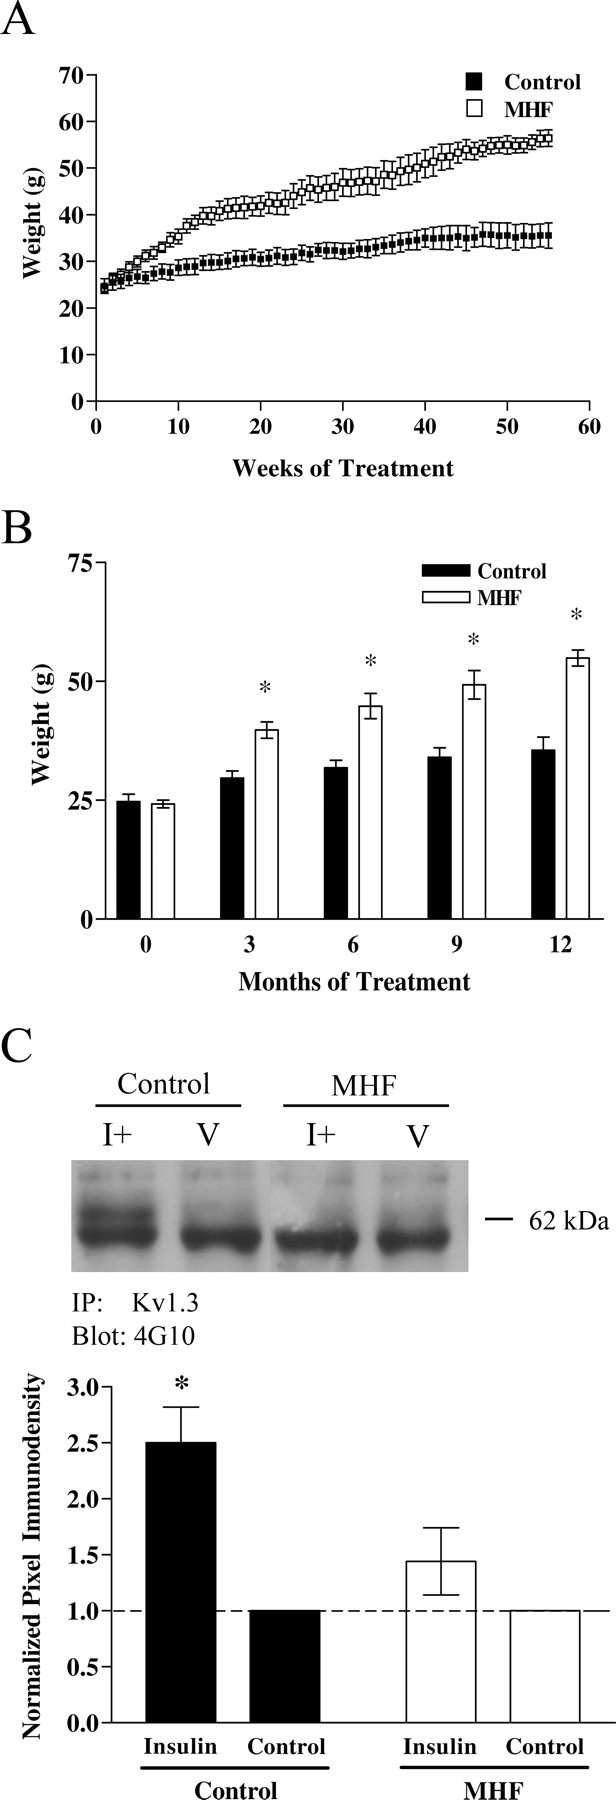
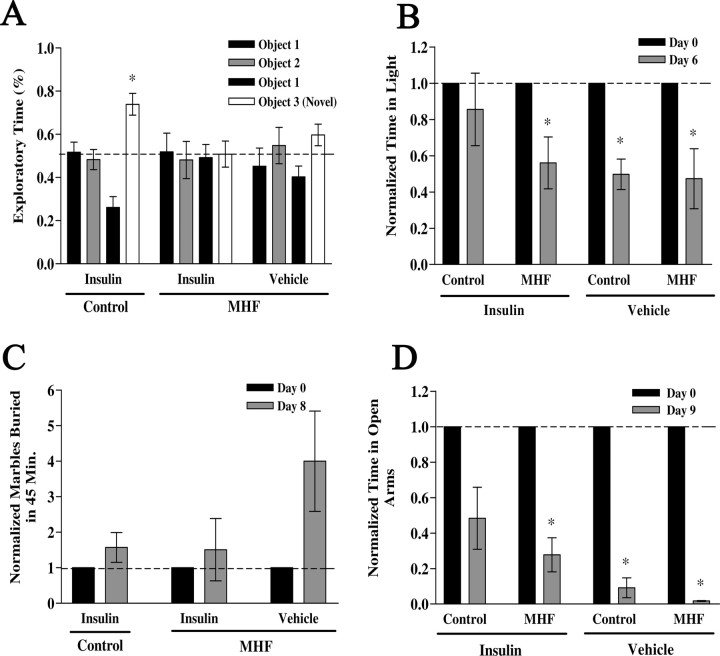
The role of insulin pathways in olfaction is of significant interest with the widespread pathology of diabetes mellitus and its associated metabolic and neuronal comorbidities. The insulin receptor (IR) kinase is expressed at high levels in the olfactory bulb, in which it suppresses a dominant Shaker ion channel (Kv1.3) via tyrosine phosphorylation of critical N- and C-terminal residues. We optimized a 7 d intranasal insulin delivery (IND) in awake mice to ascertain the biochemical and behavioral effects of insulin to this brain region, given that nasal sprays for insulin have been marketed notwithstanding our knowledge of the role of Kv1.3 in olfaction, metabolism, and axon targeting. IND evoked robust phosphorylation of Kv1.3, as well as increased channel protein-protein interactions with IR and postsynaptic density 95. IND-treated mice had an increased short- and long-term object memory recognition, increased anxiolytic behavior, and an increased odor discrimination using an odor habituation protocol but only moderate change in odor threshold using a two-choice paradigm. Unlike Kv1.3 gene-targeted deletion that alters metabolism, adiposity, and axonal targeting to defined olfactory glomeruli, suppression of Kv1.3 via IND had no effect on body weight nor the size and number of M72 glomeruli or the route of its sensory axon projections. There was no evidence of altered expression of sensory neurons in the epithelium. In mice made prediabetic via diet-induced obesity, IND was no longer effective in increasing long-term object memory recognition nor increasing anxiolytic behavior, suggesting state dependency or a degree of insulin resistance related to these behaviors.


Figures

Figure 1.
Figure 1.
Intranasal insulin evokes Kv1.3 tyrosine phosphorylation in anesthetized and awake animals. Representative Western blots and quantitative scanning densitometry summary histograms of Kv1.3 tyrosine phosphorylation under anesthetized (Kv1.3 Phosphorylation Anesth) (A, C) or awake (Kv1.3 Phosphorylation Awake) (B, C) states. Under both conditions, mice were intranasally administered insulin (I+), PBS vehicle (V), or boiled insulin (B) as indicated. Details of delivery and animal handling can be found in the methods. OBs were harvested, and Kv1.3 channel was immunoprecipitated from clarified OB lysates (IP: Kv1.3), separated via SDS-PAGE, and probed with anti-phosphotyrosine (blot: 4G10). OB lysates (lysate) were run in tandem with immunoprecipitated samples to demonstrate equal Kv1.3 expression and input (blot Kv1.3). C, Summary bar graph is the mean (±SEM) pixel density of the phosphorylated Kv1.3 band as normalized to the vehicle (dashed line, ratio of 1.0). D, Summary bar graph is the mean (±SEM) pixel density of two controls, total Kv1.3 channel (input) or actin as quantified from the lysates and similarly normalized to the vehicle. *Significantly different from vehicle by Student's t test, α = 0.05, arc-sin transformation for percentage data. Sample sizes are as indicated.
Figure 2.
Figure 2.
Insulin IND treatment enhances Kv1.3 protein–protein interactions with PSD-95 and IR. A, Representative Western blots and quantitative scanning densitometry summary histograms (B–E) of channel or kinase phosphorylation or coimmunoprecipitations as noted. Data represent awake IND delivery; protein biochemistry protocols, analysis, and applied statistics as in Figure 1. IR, Insulin receptor kinase. For each SDS-PAGE/Western blot example, two sets of awake IND treatment groups are shown to demonstrate accuracy and reproducibility across experiments. Labeling for actin in the input (lysate, blot: actin) is also demonstrated as an additional control. Sample sizes are as indicated.
Figure 3.
Figure 3.
IND treatment does not damage the olfactory epithelium, decrease olfactory sensory neuron numbers, or cause general anosmia. A–P, Representative coronal sections (16–20 μm) of the MOE were double immunolabeled with αOMP (A, E, I, M) and αGolf (B, F, J, N), and then stained with the nuclear marker DAPI (C, G, K, O). Sections were acquired from awake mice receiving IND treatment (I, insulin; P, PBS control; B, boiled insulin) or handled but not treated (U, untreated) for 7 d. Immunolabeled proteins were visualized on a confocal microscope using sequential channel scanning with a merged overlay (D, H, L, P). Note: OMP-positive OSN cell bodies and axon bundles are clearly visible, as well as Golf immunoreactivity in the cilia layer. Scale bar, 50 μm. Q, Bar graph plot of the mean number (±SEM) of OMP/DAPI positive cells per 300 μm of epithelium on two ectoturbinates (Ect 1/Ect 2) and two endoturbinates (End 1/End 2) of five animals treated as indicated. Sections were immunolabeled with αOMP and stained with DAPI, and digital images from each channel were captured and merged. The means were not significantly different by two-way ANOVA with a Student–Newman–Keuls test (α = 0.05). R, Bar graph plot of mean (±SEM) retrieval time of a hidden food odor (cracker) or similarly shaped object (marble) as a test for general anosmia for five awake IND-treated mice as indicated. *Significantly different by Student's t test, α = 0.05.
Figure 4.
Figure 4.
Insulin IND treatment does not affect glomerular position, diameter, or cross-sectional area. A–D, Representative whole-mount images of awake M72TauLacZ mice IND treated as in Figure 3. The inset box represents area of tracked M72 glomerulus after coronal sectioning and counterstaining staining with neutral red as shown in single prime lettering, respectively (A1, B1, C1, D1). Double prime lettering (A2, B2, C2, D2) are representative M72-positive OSNs sampled in the epithelium from animals in the respective treatment groups. Mice (N = 4 per treatment group) were IND-treated for 7 d. Note: No gross change in OSN morphology or axonal targeting to the M72 specific glomerulus was apparent. Histogram summary of the mean (±SEM) glomerular diameter (E) or cross-sectional area (F) of the identified M72 glomerulus as in A1, B1, C1, and D1. Not significantly different, one-way ANOVA with a Student–Newman–Keuls post hoc test (α = 0.05). Scale bar: A–D, 1 mm; A1–D1, 50 μm; A2–D2, 10 μm.
Figure 5.
Figure 5.
Insulin IND treatment does not alter peripheral glucose. Line graph of the mean (±SEM) resting (fed) blood glucose when acutely measured after awake insulin (■) or vehicle control (□) IND, as repeatedly sampled from the tail. Final measurements were sampled by trunk bleeds (see Results). NS, Not significantly different mean (±SEM) by Student's t test, α = 0.05; insulin (N = 5) or vehicle control (N = 4) IND.
Figure 6.
Figure 6.
Insulin IND treatment enhances object memory recognition. Bar graphs of the percentage of time used to explore two objects during a familiarization phase (object 1 vs object 2) or object recognition phase (object 1 vs object 3) after 5 d of IND treatment in awake mice. Mice (N = 5 per treatment group) were either challenged with a short-term object recognition test of 1 h (A) or a long-term object recognition test of 24 h (B). Data are expressed as mean (±SEM) percentage exploratory time (dashed line, ratio of 50%). Significantly different exploratory time across IND treatment (**) or across objects (*) (object 1 vs object 3) was defined by a two-way ANOVA with a Student–Newman–Keuls post hoc test, α = 0.05.
Figure 7.
Figure 7.
Insulin IND treatment evokes anxiolytic affect in three paradigms to measure anxiety behavior. Bar graph summary of the time spent in the light (A) and the number of transitions across compartments (B) for mice receiving awake IND treatment and then challenged with the LDB behavioral task. Mice (N = 5 per treatment group) were subjected to a light/dark box paradigm (for details, see Materials and Methods) 1 d before IND treatment (day 0) and after 6 d of IND treatment (day 6). Age-matched untreated animals were included and tested in the same manner (untreated), but not given any IND treatment in the intervening days between tests. A, Dashed line, Ratio of light/dark of 1.0. B, Dashed line, Mean reported values for C57B6/J mice using this standard paradigm. C, Bar graph summary of the portion of marbles buried in a 45 min trial interval for mice receiving insulin (insulin) or control vehicle (vehicle) via IND. Marble-burying behavior was assessed 1 d before IND treatment (day 0) and after 6 d of awake IND treatment (day 6) for five and four mice, respectively, in each group. D–F, Bar graph summaries of the mean time spent in open arms (D), number of transitions to open arms (E), and total number of transitions (F) for mice receiving insulin (insulin) or control vehicle (vehicle) and then challenged with the EPM behavior task. EPM behavior was assessed 1 d before IND treatment (day 0) and after 7 d of awake IND treatment (day 7) for five mice in each treatment group. *Significantly different mean (±SEM) after repeated measure (within treatment) by paired t test, α = 0.05. B, F, Note number of transitions across IND treatment is not different across treatments, indicating that basal locomotor activity in these paradigms is not affected by IND treatment.
Figure 8.
Figure 8.
Insulin IND treatment increases odor discrimination in an odorant habituation paradigm. A, B, Line graph of the mean exploratory time of an odorant for awake IND-treated mice. Habituation is induced via repeated presentation of the first odorant of the pair at a frequency of 1 min (trials 1–7), followed by a test for discrimination after habituation via exposure to a second odor on trial 8. Mice (N = 5 per treatment group) were either challenged with an odor discrimination between mixtures (geranyl/peppermint) (A) or a more difficult discrimination between a single odorant varying in chain length (C9/C10 alcohol) (B). Data are normalized (within animal) to the initial exploratory time on trial 1 to control for interanimal variability in oriented behavior. Dashed line, Ratio of 1.0. C, Bar graph of the mean exploratory time ratio (unhabituated/habituated) calculated by dividing the exploratory time of the novel odorant (trial 8) by that of the last exploratory time of the habituated odor (trial 7). Error bars indicate SEM. *Significantly different over trial, one-way ANOVA with Student–Newman–Keuls post hoc test, α = 0.05.
Figure 9.
Figure 9.
Insulin IND treatment only slightly affects odorant threshold and does not affect time to decision or the number of choices in a two-choice paradigm for odorant threshold. A, Line graph of the mean body weight for awake IND-treated mice in which either insulin (●) or boiled insulin (○) was administered on days 7–12. Body weights were carefully lowered via food restriction to 75–85% ad libitum feeding body weight during important days of the two-choice paradigm in which mice were scored for correct decision (dig) to receive a hidden food reward (honey-flavored cereal) buried under peppermint-scented litter. Working trial days are denoted by underlining and start of the IND treatment is indicated by the arrow. B–D, Histogram plot of the percentage correct decision (B), the time to reach decision (C), and the number of transitions before decision versus odorant concentration (D) represents the mean (±SEM) for 8 mice in each of the two treatment groups (insulin, solid bar; boiled insulin, open bar). Each property on the abscissa was plotted against successive 10-fold diluted odorant concentration as indicated on the ordinate (1 × 10x). Acquisition of behavior task took place on testing days 4–6, during which mice first fell at or below 80% correct decision (B, dashed line). After 5 d of IND treatment (days 7–11), mice were retested at the 1 × 10⁻⁸ odorant concentration (day 12) through a series of dilutions until odorant detection threshold was reached (50% correct choice, equivalent to chance alone). Note: Insulin IND-treated mice were able to detect odorant at 1 log unit lower magnitude than that of boiled insulin-treated mice (B), but neither treatment yielded a significant difference in the time to make a decision (C) nor number of transitions between choices (D).
Figure 10.
Figure 10.
Insulin expression in the main olfactory epithelium after IND treatment. A–P, Representative coronal sections (16–20 μm) of the MOE were double immunolabeled with αOMP (A, E, I, M) and αInsulin (B, F, J, N), and then stained with the nuclear marker DAPI (C, G, K, O). Sections were acquired from awake mice receiving IND treatment (I, insulin; P, PBS control; B, boiled insulin) or handled but not treated (U, untreated) for 7 d. Immunolabeled proteins were visualized on a confocal microscope using sequential channel scanning with a merged overlay (D, H, L, P) as in Figure 3. Note: Insulin and boiled insulin IND treatment conditions (B, J) show robust insulin immunoreactivity in all epithelial layers, especially in the cilia layer. PBS vehicle IND treatment (F) and untreated animals (N) display virtually no insulin immunoreactivity. Representative sections in which peroxidase-based immunolabeling was used for immunodetection of the primary antibody in untreated animals. P, No primary (NP) control section. R, Moderate insulin immunoreactivity in all layers of the epithelium, with labeling present in the cilia layer in which odor transduction machinery is expressed (arrow). Scale bars: A–P, 100 μm; Q, R, 25 μm.
Figure 11.
Figure 11.
IR expression in the olfactory epithelium. Same as in Figure 10, but for untreated mice double immunolabeled with α-OMP (A) and α-IR (B), and then stained with DAPI (C), and merged (D) to determine the distribution of IR in the epithelium. E–H, No primary controls (NP) demonstrating lack of immunoreactivity in the absence of αOMP or αIR primary antisera. I, J, Peroxidase-based immunolabeling: no primary control (NP) when IR antisera is omitted (I), αIR (J). K, L, Low field magnification of αIR labeling using peroxidase- and fluorescence-based detection on consecutive sections, respectively. Scale bars: A–J, 20 μm; K, L, 100 μm. M, Western blot analysis probing for αIR (Blot: IR) in purified MOE membranes (membrane prep) across various postnatal stages as indicated or in immunoprecipitates (IP: IR) prepared from P20 aged mice; 30 μg loaded protein; Mr = 97 kDa. N, Same as in M, but for whole-cell MOE lysates in which varying concentrations of loaded protein (indicated above gel) or donkey anti-rabbit secondary antisera (DAR) (below gel) were tested. Nitrocellulose membranes were cut at the 62 kDa migration marker, and the bottom one-half was probed with α-actin (blot α-actin) to verify successive increases in protein loading. Note: IR expression begins to resolve at 60 μg of loaded protein and displays very faint immunoreactivity at lower protein loading using higher secondary antisera concentrations.
Figure 12.
Figure 12.
Anti-phosphotyrosine immunoreactivity does not strongly increase after insulin IND treatment. Same as in Figure 10 (A–P) but for anti-phosphotyrosine (B, F, J, N). Scale bar, 100 μm.
Figure 13.
Figure 13.
Lack of insulin IND-induced Kv1.3 phosphorylation after maintenance on a MHF diet to yield a prediabetic state. A, B, Line (A) and bar graph (B) plotting the development of body weight gain in control (solid bars) versus MHF diet (open bars) maintained mice for a 55 week period. Data represent the mean (±SEM) of eight mice in each diet treatment group before IND treatment. *Significantly different mean, two-way ANOVA with a Student–Newman–Keuls test (α = 0.05). C, Representative Western blot and quantitative scanning densitometry summary bar graph of Kv1.3 tyrosine phosphorylation (62 kDa) in OB of control and MHF diet fed mice. The bottom band in all conditions is the heavy band of IgG. Analysis, IND treatment interval, and notation are as in Figure 1.
Figure 14.
Figure 14.
Increased object memory and anxiolytic behaviors after insulin IND treatment is dampened in prediabetic mice. A–D, The effect of MHF diet on IND treatment induced behaviors are plotted for long-term (24 h) object memory (A), LDB paradigm (B), MB behavior (C), and EPM performance (D). See text for details of methods and Figures 6 and 7 for notation, analysis, and statistical design. *Significantly different mean (±SEM) after repeated measure (within treatment) by paired t test, α = 0.05, N = 2–5 per treatment group.

Similar articles

Cited by

References

    1. Aimé P, Duchamp-Viret P, Chaput MA, Savigner A, Mahfouz M, Julliard AK. Fasting increases satiation decreases olfactory detection for a neutral odor in rats. Behav Brain Res. 2007;179:258–264. - PubMed
    1. Apelbaum AF, Chaput MA. Rats habituated to chronic feeding restriction show a smaller increase in olfactory bulb reactivity compared to newly fasted rats. Chem Senses. 2003;28:389–395. - PubMed
    1. Arnold DB, Clapham DE. Molecular determinants for subcellular localization of PSD-95 with an interacting K+ channel. Neuron. 1999;23:149–157. - PubMed
    1. Baly C, Aioun J, Badonnel K, Lacroix MC, Durieux D, Schlegel C, Salesse R, Caillol M. Leptin and its receptors are present in the rat olfactory mucosa and modulated by the nutritional status. Brain Res. 2007;1129:130–141. - PubMed
    1. Banks WA. The source of cerebral insulin. Eur J Pharmacol. 2004;490:5–12. - PubMed

Publication types

MeSH terms