

Microglia and the urokinase plasminogen activator receptor/uPA system in innate brain inflammation
- PMID: 19459212
- PMCID: PMC2816357
- DOI: 10.1002/glia.20892
Microglia and the urokinase plasminogen activator receptor/uPA system in innate brain inflammation
Abstract
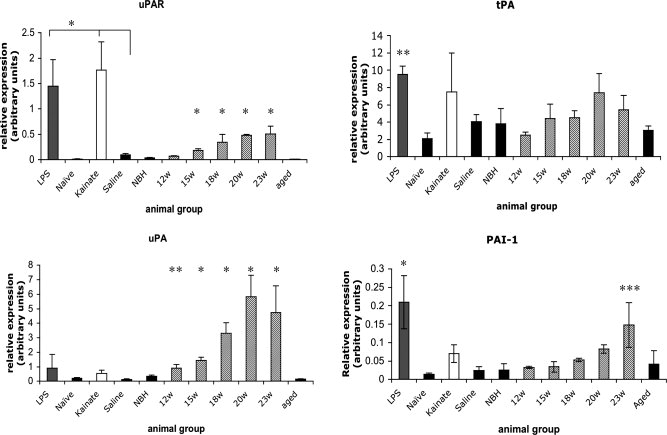
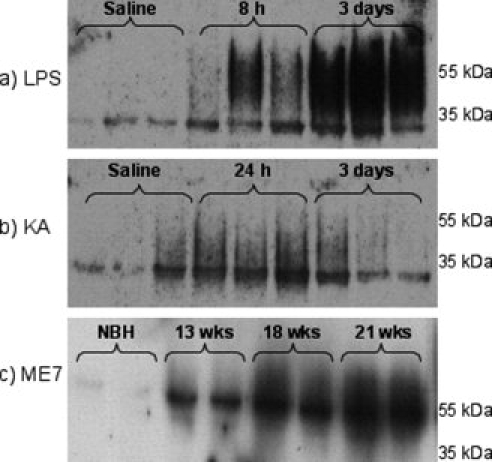
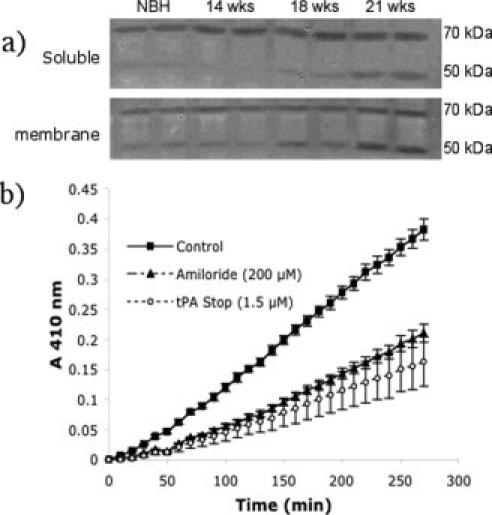
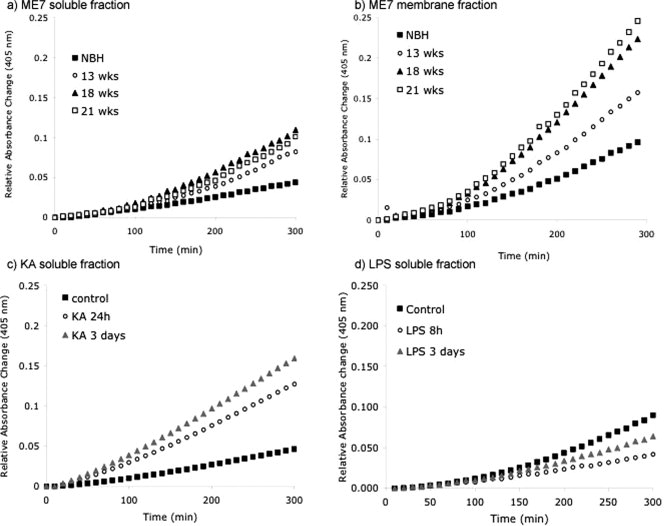
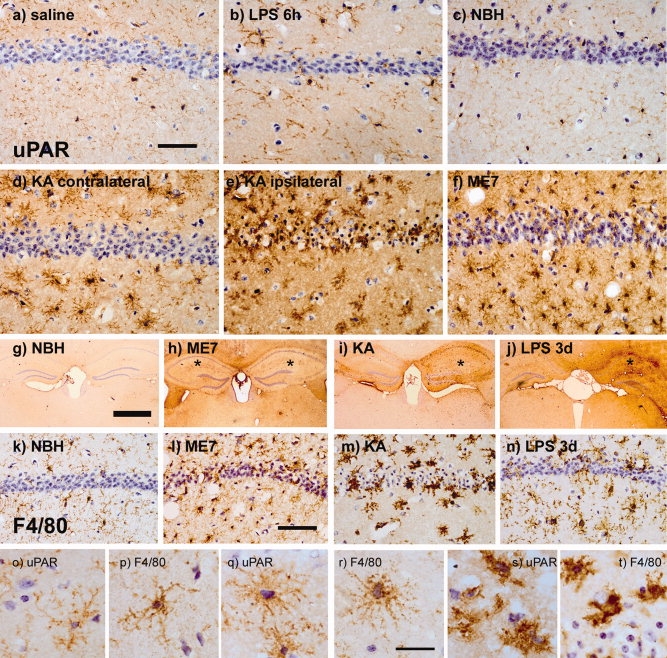
The urokinase plasminogen activator (uPA) receptor (uPAR) is a GPI-linked cell surface protein that facilitates focused plasmin proteolytic activity at the cell surface. uPAR has been detected in macrophages infiltrating the central nervous system (CNS) and soluble uPAR has been detected in the cerebrospinal fluid during a number of CNS pathologies. However, its expression by resident microglial cells in vivo remains uncertain. In this work, we aimed to elucidate the murine CNS expression of uPAR and uPA as well as that of tissue plasminogen activator and plasminogen activator inhibitor 1 (PAI-1) during insults generating distinct and well-characterized inflammatory responses; acute intracerebral lipopolysaccharide (LPS), acute kainate-induced neurodegeneration, and chronic neurodegeneration induced by prion disease inoculation. All three insults induced marked expression of uPAR at both mRNA and protein level compared to controls (naïve, saline, or control inoculum-injected). uPAR expression was microglial in all cases. Conversely, uPA transcription and activity was only markedly increased during chronic neurodegeneration. Dissociation of uPA and uPAR levels in acute challenges is suggestive of additional proteolysis-independent roles for uPAR. PAI-1 was most highly expressed upon LPS challenge, whereas tissue plasminogen activator mRNA was constitutively present and less responsive to all insults studied. These data are novel and suggest much wider involvement of the uPAR/uPA system in CNS function and pathology than previously supposed.
Figures
Similar articles
-
The urokinase-system in tumor tissue stroma of the breast and breast cancer cell invasion.Int J Oncol. 2009 Jan;34(1):15-23. Int J Oncol. 2009. PMID: 19082473
-
Tissue plasminogen activator and urokinase plasminogen activator in human epileptogenic pathologies.Neuroscience. 2010 May 19;167(3):929-45. doi: 10.1016/j.neuroscience.2010.02.047. Epub 2010 Feb 26. Neuroscience. 2010. PMID: 20219643
-
Urokinase plasminogen activator, uPa receptor, and its inhibitor in vernal keratoconjunctivitis.Invest Ophthalmol Vis Sci. 2005 Apr;46(4):1364-70. doi: 10.1167/iovs.04-1196. Invest Ophthalmol Vis Sci. 2005. PMID: 15790903
-
VEGF-initiated angiogenesis and the uPA/uPAR system.Cell Adh Migr. 2012 Nov-Dec;6(6):535-615. doi: 10.4161/cam.22243. Epub 2012 Oct 17. Cell Adh Migr. 2012. PMID: 23076133 Free PMC article. Review.
-
Regulation and interactions in the activation of cell-associated plasminogen.Cell Mol Life Sci. 2004 Nov;61(22):2840-58. doi: 10.1007/s00018-004-4230-9. Cell Mol Life Sci. 2004. PMID: 15558213 Free PMC article. Review.
Cited by
-
The voltage-dependent anion channel (VDAC) binds tissue-type plasminogen activator and promotes activation of plasminogen on the cell surface.J Biol Chem. 2013 Jan 4;288(1):498-509. doi: 10.1074/jbc.M112.412502. Epub 2012 Nov 16. J Biol Chem. 2013. PMID: 23161549 Free PMC article.
-
Soluble urokinase plasminogen activator receptor as a marker for use of antidepressants.PLoS One. 2014 Oct 20;9(10):e110555. doi: 10.1371/journal.pone.0110555. eCollection 2014. PLoS One. 2014. PMID: 25329298 Free PMC article. Clinical Trial.
-
Heterogeneity of microglia and TNF signaling as determinants for neuronal death or survival.Neurotoxicology. 2009 Sep;30(5):785-93. doi: 10.1016/j.neuro.2009.07.001. Epub 2009 Jul 9. Neurotoxicology. 2009. PMID: 19596372 Free PMC article. Review.
-
Microglia in the degenerating brain are capable of phagocytosis of beads and of apoptotic cells, but do not efficiently remove PrPSc, even upon LPS stimulation.Glia. 2010 Dec;58(16):2017-30. doi: 10.1002/glia.21070. Glia. 2010. PMID: 20878768 Free PMC article.
-
A systematic analysis of the peripheral and CNS effects of systemic LPS, IL-1β, [corrected] TNF-α and IL-6 challenges in C57BL/6 mice.PLoS One. 2013 Jul 1;8(7):e69123. doi: 10.1371/journal.pone.0069123. Print 2013. PLoS One. 2013. PMID: 23840908 Free PMC article.
References
-
- Akiyama H, Kawamata T, Dedhar S, McGeer PL. Immunohistochemical localization of vitronectin, its receptor and β-3 integrin in Alzheimer brain tissue. J Neuroimmunol. 1991;32:19–28. - PubMed
-
- Allan EH, Martin TJ. Prostaglandin E2 regulates production of plasminogen activator isoenzymes, urokinase receptor, and plasminogen activator inhibitor-1 in primary cultures of rat calvarial osteoblasts. J Cell Physiol. 1995;165:521–529. - PubMed
-
- Andersson PB, Perry VH, Gordon S. The CNS acute inflammatory response to excitotoxic neuronal cell death. Immunol Lett. 1991a;30:177–181. - PubMed
-
- Andersson PB, Perry VH, Gordon S. The kinetics and morphological characteristics of the macrophage-microglial response to kainic acid-induced neuronal degeneration. Neuroscience. 1991b;42:201–214. - PubMed
-
- Andersson PB, Perry VH, Gordon S. The acute inflammatory response to lipopolysaccharide in CNS parenchyma differs from that in other body tissues. Neuroscience. 1992;48:169–186. - PubMed
Publication types
MeSH terms
Substances
Grants and funding
LinkOut - more resources
Full Text Sources
Medical
Miscellaneous
