. 2009 Aug;100(8):1544-9.
doi: 10.1111/j.1349-7006.2009.01199.x. Epub 2009 May 13.

Quantification of mouse pulmonary cancer models by microcomputed tomography imaging

Affiliations

Quantification of mouse pulmonary cancer models by microcomputed tomography imaging

Hiroshi Fushiki et al. Cancer Sci. 2009 Aug.

Abstract

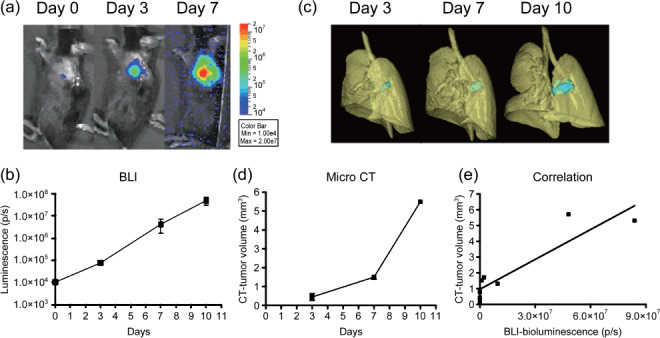
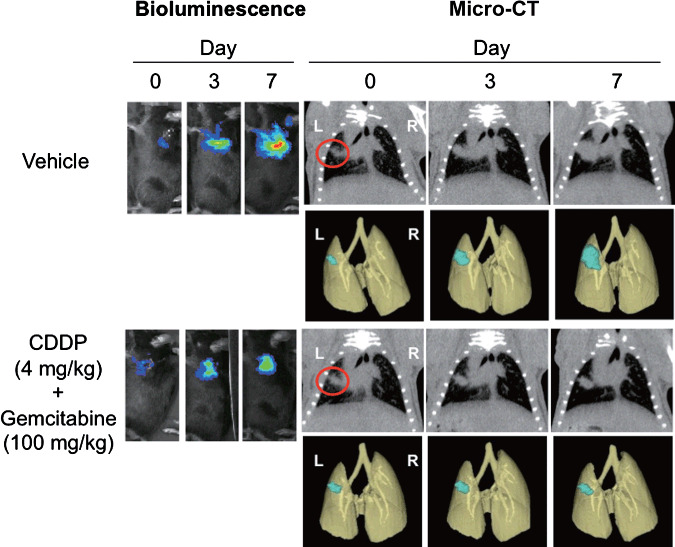
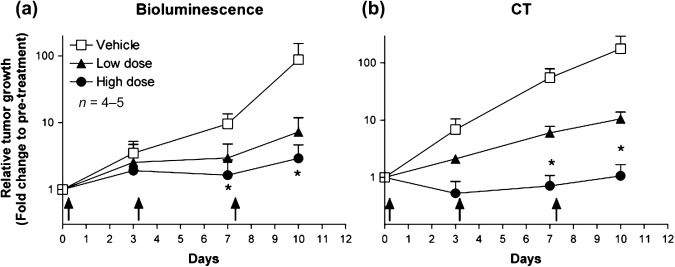
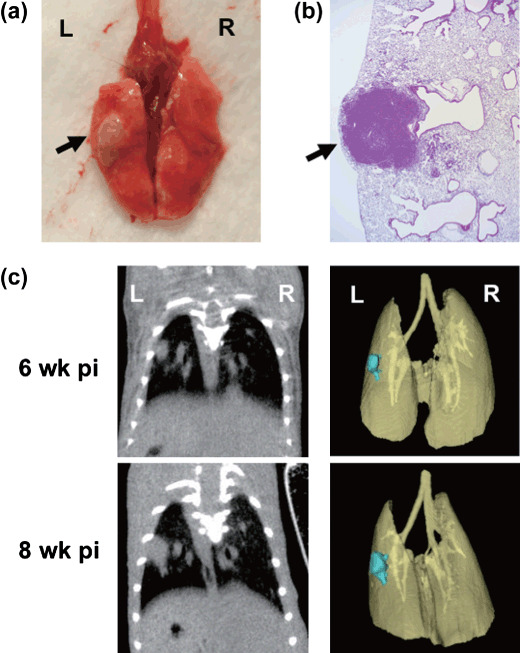
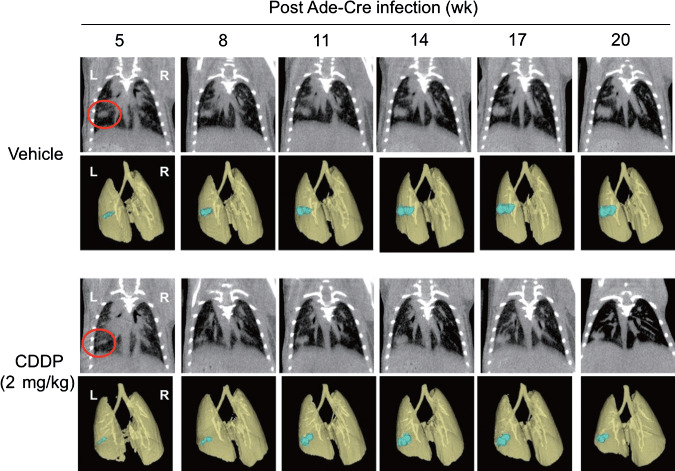
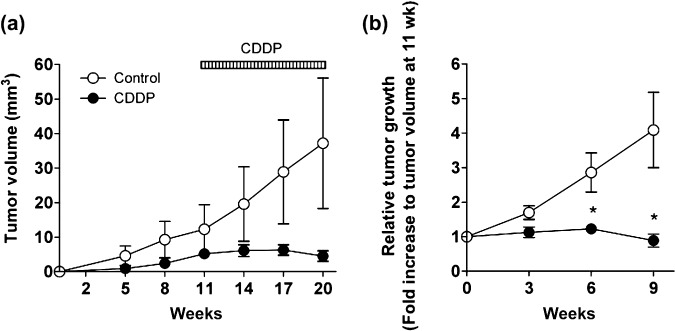
The advances in preclinical cancer models, including orthotopic implantation models or genetically engineered mouse models of cancer, enable pursuing the molecular mechanism of cancer disease that might mimic genetic and biological processes in humans. Lung cancer is the major cause of cancer deaths; therefore, the treatment and prevention of lung cancer are expected to be improved by a better understanding of the complex mechanism of disease. In this study, we have examined the quantification of two distinct mouse lung cancer models by utilizing imaging modalities for monitoring tumor progression and drug efficacy evaluation. The utility of microcomputed tomography (micro-CT) for real-time/non-invasive monitoring of lung cancer progression has been confirmed by combining bioluminescent imaging and histopathological analyses. Further, we have developed a more clinically relevant lung cancer model by utilizing K-ras(LSL-G12D)/p53(LSL-R270H) mutant mice. Using micro-CT imaging, we monitored the development and progression of solitary lung tumor in K-ras(LSL-G12D)/p53(LSL-R270H) mutant mouse, and further demonstrated tumor growth inhibition by anticancer drug treatment. These results clearly indicate that imaging-guided evaluation of more clinically relevant tumor models would improve the process of new drug discovery and increase the probability of success in subsequent clinical studies.


Figures

Figure 1
Figure 1
Non‐invasive monitoring of pulmonary tumor growth in an orthotopic lung cancer implantation model. Mice were intrapulmonary inoculated with luciferase‐expressing mouse Lewis Lung Carcinoma cell line (3LL‐luc2) cells (1000 cells in 20 µL volume) on day 0, and then monitored for orthotopic tumor growth by bioluminescence imaging (BLI) (a,b) or microcomputed tomography (micro‐CT) (c,d) on indicated days after tumor inoculation. Images of the 3D‐reconstituted tumor colony are shown in blue. Data represent mean ± SEM. n = 3, except CT images on day 10 (n = 2). (e) Relationship between BLI of tumor and tumor volume reconstituted from micro‐CT images.
Figure 2
Figure 2
Bioluminescence imaging (BLI) and microcomputed tomography (micro‐CT) images of orthotopically implanted pulmonary tumor growth treated with combination chemotherapy. Mice were intrapulmonary inoculated with luciferase‐expressing mouse Lewis Lung Carcinoma cell line (3LL‐luc2) cells (1000 cells in 20 µL volume) on day 0, and then monitored for orthotopic tumor growth by BLI and micro‐CT. Images of the 3D‐reconstituted tumor colony are shown in blue. Mice were randomly assigned into study groups 7 days after the tumor inoculation and were treated with CDDP (cisplatin)/Gemcitabine. BLI and micro‐CT images were taken on indicated days after tumor inoculation. Representative images of five mice for each group are shown.
Figure 3
Figure 3
Effect of combination chemotherapy on orthotopically implanted pulmonary tumor growth quantified by bioluminescence imaging (BLI) and microcomputed tomography (micro‐CT). Summary of quantitative analysis of BLI (a) or micro‐CT imaging (b) are shown. Data represent mean ± SEM. Arrows indicate where CDDP (cisplatin)/Gemcitabine were administered. * P < 0.05.
Figure 4
Figure 4
Intrapulmonary recombinant adenovirus expressing Cre recombinase (Ade‐Cre) delivery formed mouse solitary lung cancer in K‐rasLSL–G12D/p53LSL–R270H mice, and real‐time monitoring by micro‐CT imaging. Ade‐Cre (108 pfu in 2 µL volume) was intrapulmonary injected into K‐ras/p53 mice. Representative macroscopic observation of Ade‐Cre‐induced lung solitary tumor (a) and histopathological observation (b) at 10 weeks post infection are shown. Arrows indicate where solitary tumor nodule was observed. Representative 3D‐reconstituted micro‐CT images of solitary lung tumor at 6 or 8 weeks post infection are shown (c). Images of the 3D‐reconstituted tumor colony are shown in blue.
Figure 5
Figure 5
Microcomputed tomography (micro‐CT) images of solitary lung tumor growth in K‐rasLSL–G12D/p53LSL–R270H mice. K‐ras/p53 mice were intrapulmonary infected with recombinant adenovirus expressing Cre recombinase (Ade‐Cre) (108 pfu in 2 µL volume), and then lung solitary tumor development and growth was monitored by micro‐CT. Images of the 3D‐reconstituted tumor colony are shown in blue. Eleven weeks after post Ade‐Cre infection, mice were prescanned by micro‐CT, then randomly assigned into two study groups. The group of mice were treated with saline (i.p., 100 µL) or CDDP (cisplantin) (i.p., 2 mg/kg, twice a week). Micro‐CT images were taken on indicated weeks after Ade‐Cre infection. Representative images of five mice for each group are shown. *P < 0.05.
Figure 6
Figure 6
Effect of chemotherapy on solitary lung tumor growth in K‐rasLSL–G12D/p53LSL–R270H mice quantified by microcomputed tomography (micro‐CT). Summary of quantitative analysis of micro‐CT imaging, presented in Figure 5, is shown. (a) The growth curve of lung tumor in K‐ras/p53 mice. (b) Relative tumor size to prescanned tumor (at 11 weeks post recombinant adenovirus expressing Cre recombinase [Ade‐Cre] infection) in K‐ras/p53 mice. Data represent mean ± SEM.

References

    1. Herbst RS, Heymach JV, Lippman SM. Lung cancer. N Engl J Med 2008; 359(13): 1367–80. - PMC - PubMed
    1. Frese KK. Tuveson DA. Maximizing mouse cancer models. Nat Rev Cancer 2007; 7(9): 645–58. - PubMed
    1. Sharpless NE, Depinho RA. The mighty mouse: genetically engineered mouse models in cancer drug development. Nat Rev Drug Discov 2006; 5(9): 741–54. - PubMed
    1. Doki Y, Murakami K, Yamaura T, Sugiyama S, Misaki T, Saiki I. Mediastinal lymph node metastasis model by orthotopic intrapulmonary implantation of Lewis lung carcinoma cells in mice. Br J Cancer 1999; 79(7–8): 1121–6. - PMC - PubMed
    1. Jackson EL, Willis N, Mercer K, et al . Analysis of lung tumor initiation and progression using conditional expression of oncogenic K‐ras. Genes Dev 2001; 15(24): 3243–8. - PMC - PubMed

MeSH terms