. 2009 May 21:9:16.
doi: 10.1186/1472-6785-9-16.

Living at the edge: biogeographic patterns of habitat segregation conform to speciation by niche expansion in Anopheles gambiae

Affiliations

Living at the edge: biogeographic patterns of habitat segregation conform to speciation by niche expansion in Anopheles gambiae

Carlo Costantini et al. BMC Ecol. .

Abstract

Background: Ongoing lineage splitting within the African malaria mosquito Anopheles gambiae is compatible with ecological speciation, the evolution of reproductive isolation by divergent natural selection acting on two populations exploiting alternative resources. Divergence between two molecular forms (M and S) identified by fixed differences in rDNA, and characterized by marked, although incomplete, reproductive isolation is occurring in West and Central Africa. To elucidate the role that ecology and geography play in speciation, we carried out a countrywide analysis of An. gambiae M and S habitat requirements, and that of their chromosomal variants, across Burkina Faso.

Results: Maps of relative abundance by geostatistical interpolators produced a distinct pattern of distribution: the M-form dominated in the northernmost arid zones, the S-form in the more humid southern regions. Maps of habitat suitability, quantified by Ecological Niche Factor Analysis based on 15 eco-geographical variables revealed less contrast among forms. M was peculiar as it occurred proportionally more in habitat of marginal quality. Measures of ecological niche breadth and overlap confirmed the mismatch between the fundamental and realized patterns of habitat occupation: forms segregated more than expected from the extent of divergence of their environmental envelope--a signature of niche expansion. Classification of chromosomal arm 2R karyotypes by multilocus genetic clustering identified two clusters loosely corresponding to molecular forms, with 'mismatches' representing admixed individuals due to shared ancestral polymorphism and/or residual hybridization. In multivariate ordination space, these karyotypes plotted in habitat of more marginal quality compared to non-admixed, 'typical', karyotypes. The distribution of 'typical' karyotypes along the main eco-climatic gradient followed a consistent pattern within and between forms, indicating an adaptive role of inversions at this geographical scale.

Conclusion: Ecological segregation between M and S is consistent with niche expansion into marginal habitats by chromosomal inversion variants during early lineage divergence; presumably, this process is promoted by inter-karyotype competition in the higher-quality core habitat. We propose that the appearance of favourable allelic combinations in other regions of suppressed recombination (e.g. pericentromeric portions defining speciation islands in An. gambiae) fosters development of reproductive isolation to protect linkage between separate chromosomal regions.


Figures
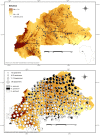
Figure 1
Figure 1
Study area and observed relative abundance of members of the Anopheles gambiae complex in Burkina Faso. Map of sampled locations (above), with pies showing results of molecular identifications (below) expressed as relative frequencies of members of the An. gambiae s.l. complex (shading inside the pie), and total sample size (size of the pie) from each location.
Figure 2
Figure 2
Interpolated relative abundance of members of the Anopheles gambiae complex in Burkina Faso. Maps of the kriged relative frequency of members of the Anopheles gambiae complex across Burkina Faso: A) An. arabiensis (vs. An. gambiae); B) An. gambiae molecular form S (vs. form M). The figure also shows major populated places (>10,000 inhabitants; labelled dots), and sampled locations used as interpolators (stars). Continuous lines denote mean annual rainfall isohyets for the period 1970–2000.
Figure 3
Figure 3
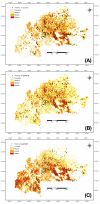
Maps of the Habitat Suitability Index for members of the Anopheles gambiae complex in Burkina Faso. Habitat suitability maps derived from the Ecological Niche Factor Analyses of (A) An. arabiensis; (B) An. gambiae molecular form M; and (C) An. gambiae molecular form S.
Figure 4
Figure 4
Assignment of An. gambiae s.s. karyotypes by multilocus genetic clustering. Results of the STRUCTURE analysis assuming K = 2 clusters (see additional file 8). The plot shows the probability that each of the 3,377 karyotyped mosquitoes, represented by a single bar along the abscissa, belongs to Cluster 1 (black bars). The corresponding probability value for Cluster 2 is the complement to 100% (yellow bars). The individual bars appear as solid colour because they are tightly spaced. Individual mosquitoes are ordered along the abscissa according to molecular form status (M, MS 'hybrids', S), and then by increasing probability of belonging to Cluster 1.
Figure 5
Figure 5
Detrended Correspondence Analysis of An. gambiae s.s. karyotypes distribution across sampled locations by molecular form. Distribution of karyotypes in ordination space, plotted over the first and second ordination axes. For visualization purposes, the diagram is split in four separate diagrams. Common karyotypes (weight in analysis >1%) are plotted in (A), rarer karyotypes in (B). Continuous eco-geographical variables (EGVs) are passively plotted in (C) and nominal variables in (D). Karyotypes of An. gambiae form M are designed by blue circles, those of the S form by green squares. In (C), climatic EGVs are symbolized by blue arrows, topographic variables by red arrows, land cover variables by black arrows and the molecular form relative abundance by green arrows. In (D), the vegetation classes are in green, and the habitat suitability classes are in red. Note that the scale is not the same across sub-diagrams. Circled karyotypes are those discussed in text.
Figure 6
Figure 6
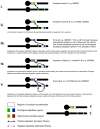
Hypothetical evolutionary path leading to adaptive ecological divergence of some chromosome-2 variants of Anopheles gambiae molecular forms. The figure shows second-order polynomial 'species' response curves [58,69] fitting the data set of karyotype frequencies (P < 0.01 in all cases). The response on the ordinate is a measure of relative abundance that is taken as a proxy of fitness. Axis 1 in (A) and Axis 2 in (B) on the abscissa are the same ordination axes as in Figure 5. They are interpreted to represent environmental gradients related to a major eco-geographical cline (Axis 1 – xeric conditions at higher latitudes on the left, mesic conditions at lower latitudes on the right), and to general habitat quality (Axis 2 – increasing habitat quality from left to right). The curves visualize the optimum response (the point on the abscissa falling at the maximum of the curve), and the degree of tolerance (the width of the curve around the optimum) of each karyotype along the environmental gradients. In (A), arrows point to a postulated sequence of chromosomal mutation and allele assortment events leading to a habitat shift from a monomorphic standard karyotype (00000S) to a typical Cluster 2/M karyotype (02200M) via typical Cluster 1/S (02000S) and then 'atypical' (02000M, 02100M) karyotypes. The letter "M" marks the appearance of ecologically adaptive genes in the independently segregating pericentromeric region of the X chromosome. The figure also shows that 02100S karyotypes share similar habitat optima and tolerance but lower fitness than 02000S karyotypes. In the face of competition with 02000S, therefore, 02100M and the 'atypical' 02000M karyotypes compete less against 02000S by occupying more marginal habitats, particularly on the habitat quality gradient (Axis 2 in B), compared to 02100S. In (B) it is apparent the greater degree of tolerance of M karyotypes, with optima shifted to habitat of overall lower quality relative to S. This evolutionary path is not exclusive and it is taken as an example for illustrative purposes: other paths involving different sets of karyotypes are also possible (not shown).
Figure 7
Figure 7
Exemplifying evolutionary steps involved in the process of ecological adaptation and speciation of M and S. Diagrammatic sequence of hypothetical genomic and chromosomal events on chromosome 2 and the X heterosome leading to ecological niche expansion and reproductive isolation in An. gambiae molecular forms following the evolutionary path exemplified in Figure 6.

References

    1. Schluter D. Ecological causes of speciation. In: Howard DJ, Berlocher SH, editor. Endless Forms. Oxford: Oxford University Press; 1998. pp. 114–129.
    1. Schluter D. Ecology and the origin of species. Trends in Ecology & Evolution. 2001;16:372–380. doi: 10.1016/S0169-5347(01)02198-X. - DOI - PubMed
    1. McKinnon JS, Mori S, Blackman BK, David L, Kingsley DM, Jamieson L, Chou J, Schluter D. Evidence for ecology's role in speciation. Nature. 2004;429:294–298. doi: 10.1038/nature02556. - DOI - PubMed
    1. Rundle HD, Nosil P. Ecological speciation. Ecology Letters. 2005;8:336–352. doi: 10.1111/j.1461-0248.2004.00715.x. - DOI
    1. Funk DJ, Nosil P, Etges WJ. Ecological divergence exhibits consistently positive associations with reproductive isolation across disparate taxa. Proceedings of the National Academy of Sciences USA. 2006;103:3209–3213. doi: 10.1073/pnas.0508653103. - DOI - PMC - PubMed

Publication types