. 2009 Sep;47(3):1092-104.
doi: 10.1016/j.neuroimage.2009.05.030. Epub 2009 May 19.

fMRI in the presence of task-correlated breathing variations

Affiliations

fMRI in the presence of task-correlated breathing variations

Rasmus M Birn et al. Neuroimage. 2009 Sep.

Abstract

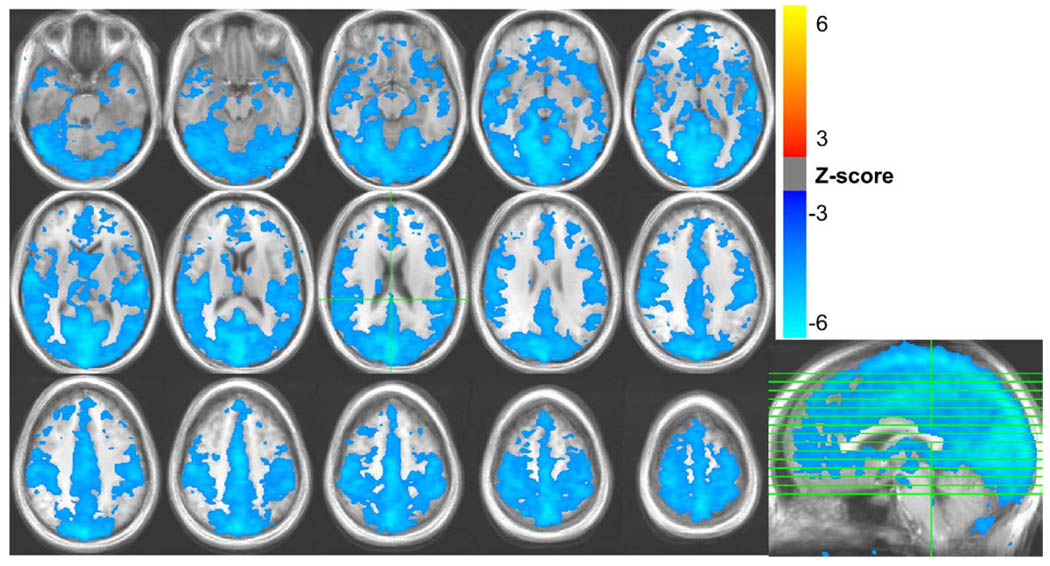
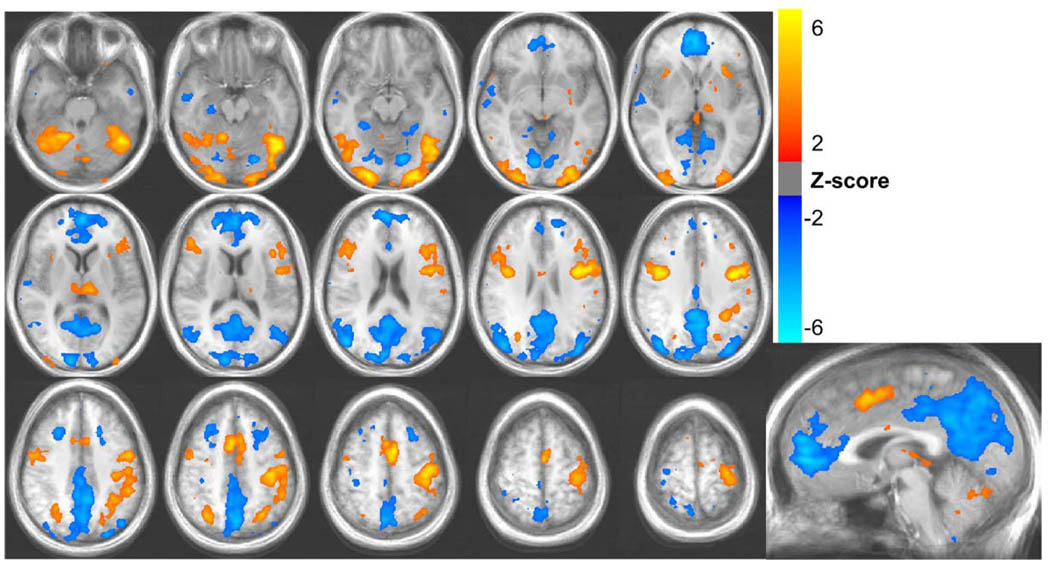
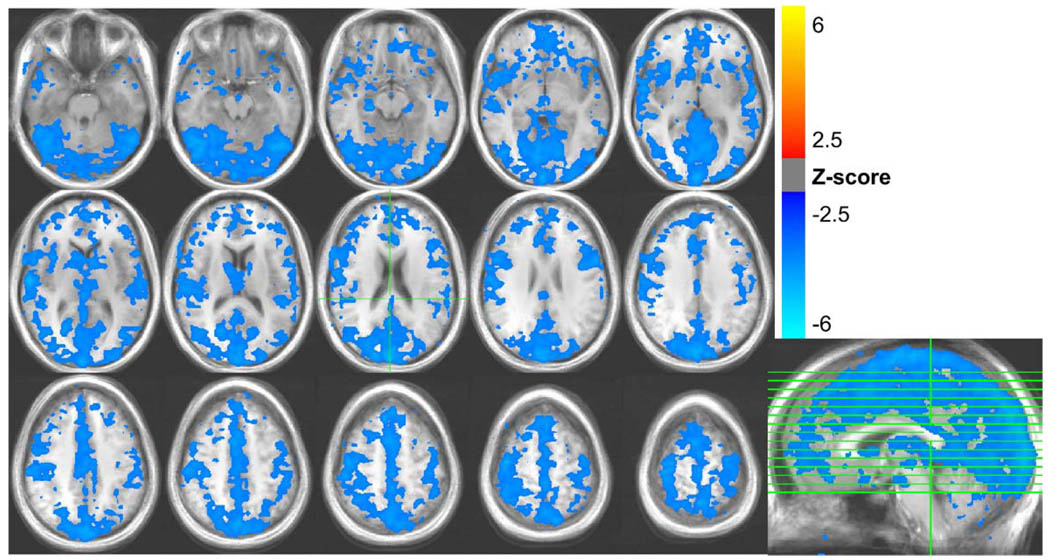
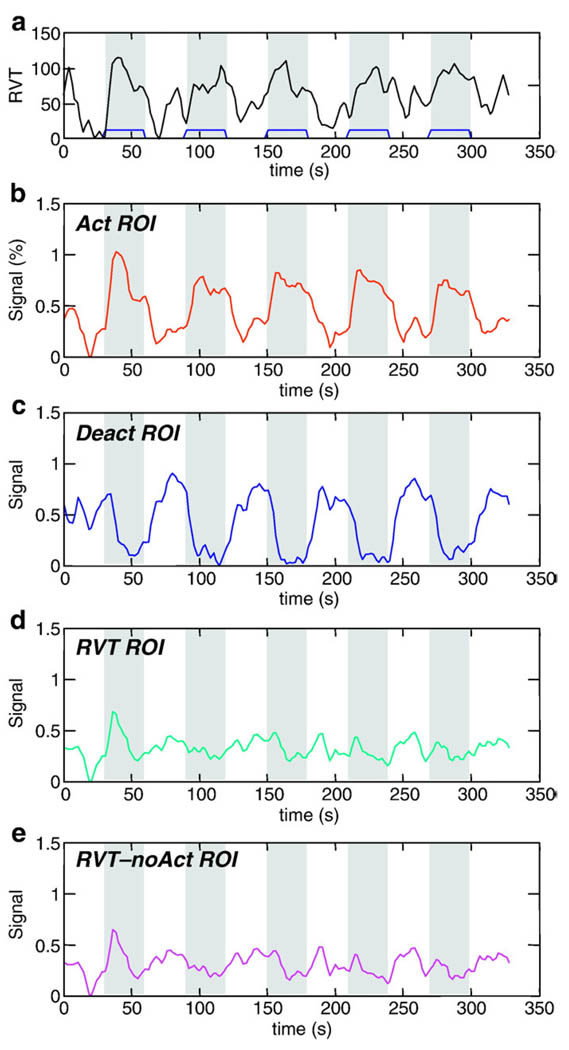
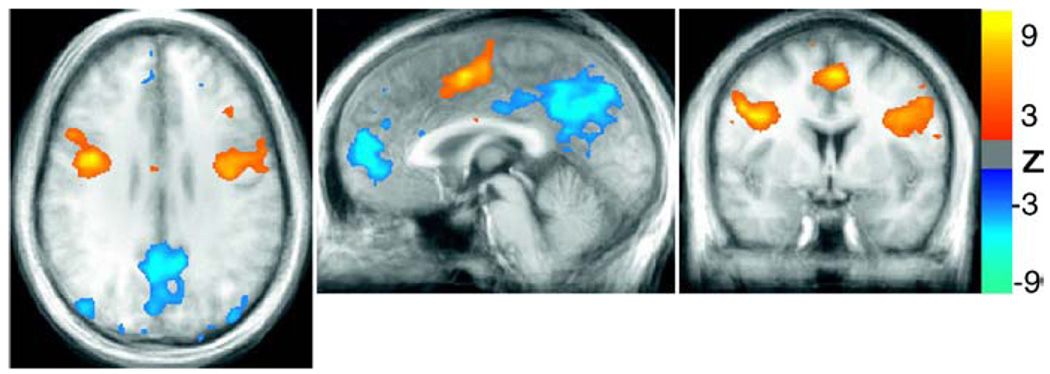
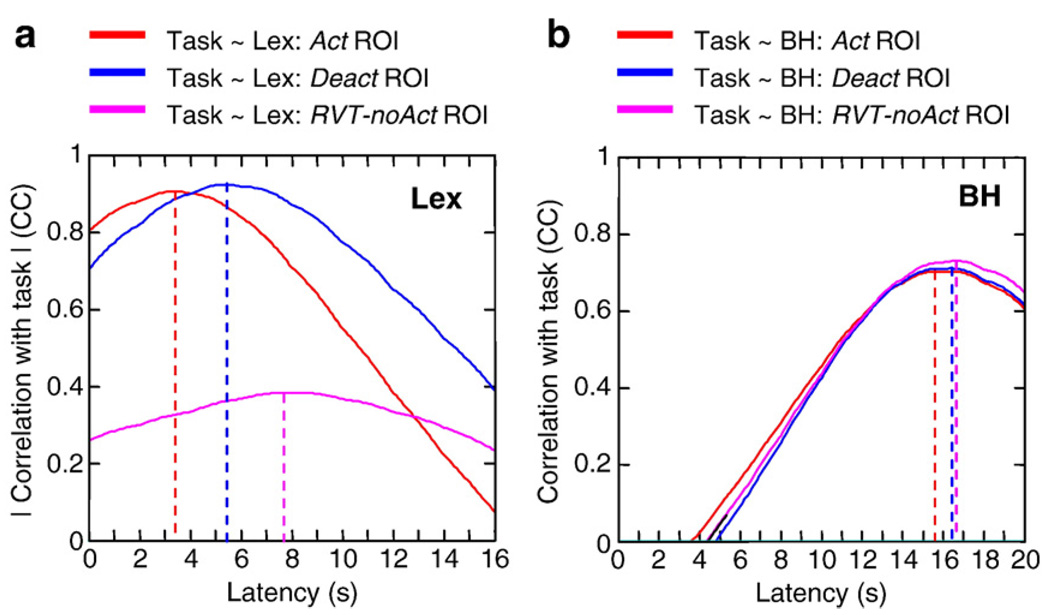
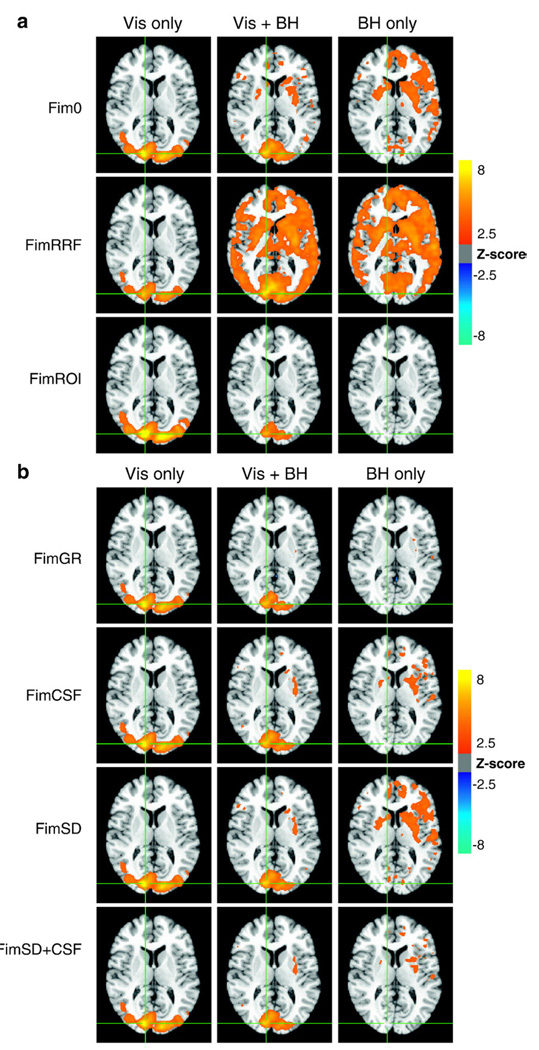
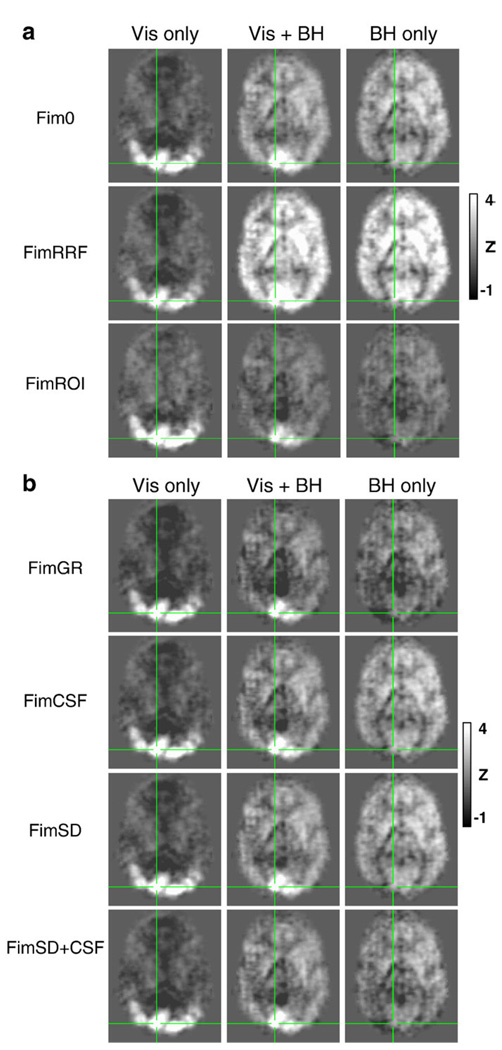
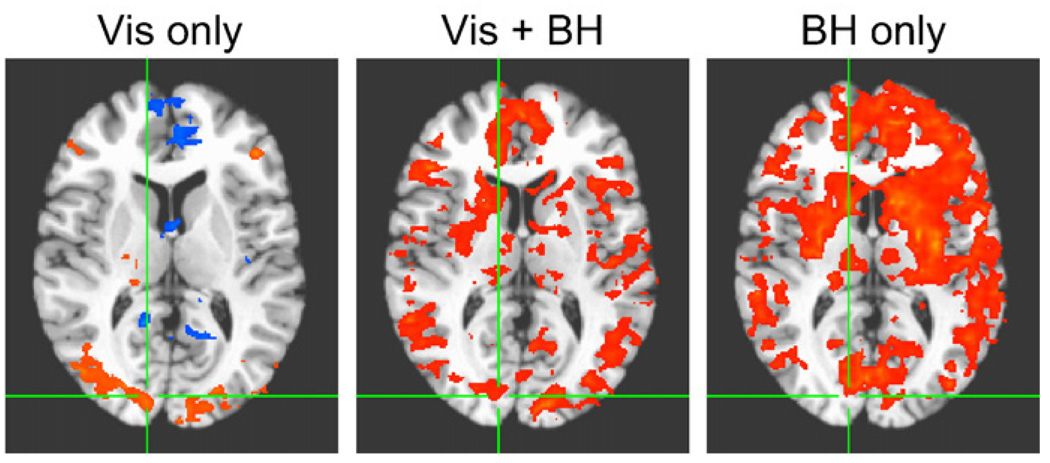
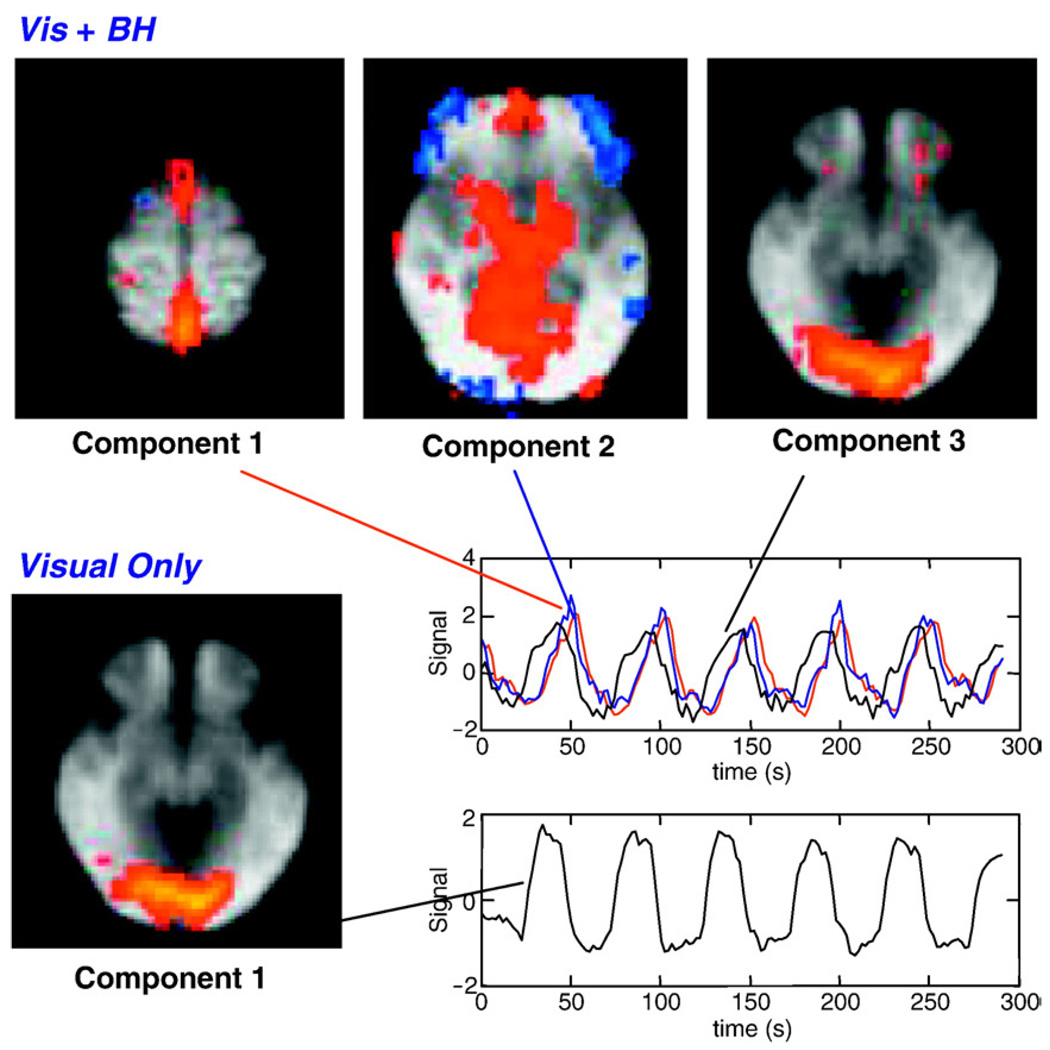
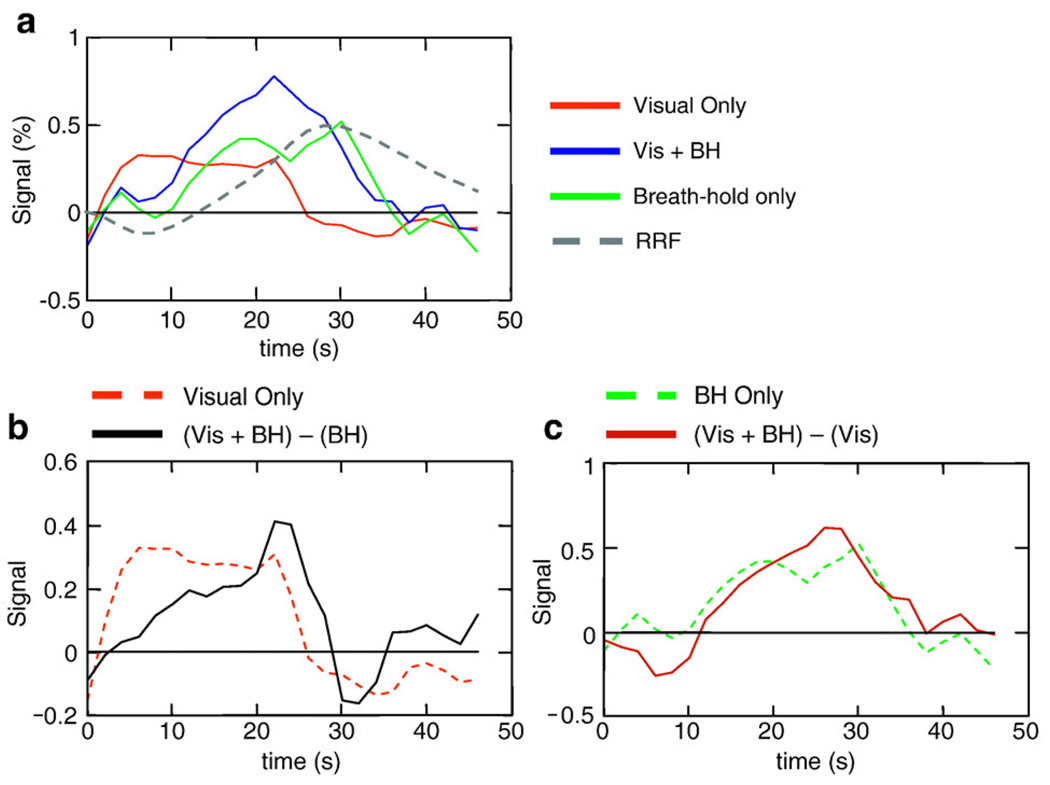
Variations in the subject's heart rate and breathing pattern have been shown to result in significant fMRI signal changes, mediated in part by non-neuronal physiological mechanisms such as global changes in levels of arterial CO(2). When these physiological changes are correlated with a task, as may happen in response to emotional stimuli or tasks that change levels of arousal, a concern arises that non-neuronal physiologically-induced signal changes may be misinterpreted as reflecting task-related neuronal activation. The purpose of this study is to provide information that can help in determining whether task activation maps are influenced by task-correlated physiological noise, particularly task-correlated breathing changes. We also compare different strategies to reduce the influence of physiological noise. Two paradigms are investigated--1) a lexical decision task where some subjects showed task-related breathing changes, and 2) a task where subjects were instructed to hold their breath during the presentation of contrast-reversing checkerboard, an extreme case of task-correlated physiological noise. Consistent with previous literature, we find that MRI signal changes correlated with variations in breathing depth and rate have a characteristic spatial and temporal profile that is different from the typical activation-induced BOLD response. The delineation of activation in the presence of task correlated breathing changes was improved either by independent component analysis, or by including specific nuisance regressors in a regression analysis. The difference in the spatial and temporal characteristics of physiological-induced and neuronal-induced fluctuations exploited by these strategies suggests that activation can be studied even in the presence of task-correlated physiological changes.


Figures

Fig. 1
Fig. 1
Areas with significant signal changes correlated with variations in the respiration volume per unit time (RVT) during rest, averaged over all 10 subjects.
Fig. 2
Fig. 2
Activations (red/yellow) and de-activations (blue) during the lexical task. Average Z-scores from 10 subjects are shown.
Fig. 3
Fig. 3
Areas with significant signal changes correlated with variations in the respiration volume per unit time (RVT) during the lexical task, averaged over all 10 subjects.
Fig. 4
Fig. 4
(a) Time course of respiration volume per time during the lexical task averaged over all subjects. Bottom 4 graphs show signal intensity time courses averaged over all subjects and over different regions of interest: regions with significant (b) activation, (c) de-activation (relative to resting baseline), (d) RVT changes, and (e) RVT changes outside of regions showing lexical activations or deactivations. Times during which the lexical task was performed are indicated in gray.
Fig. 5
Fig. 5
Activations (orange) and deactivations (blue) from 5 runs with a relatively high correlation between the RVT and task (average CC = 0.35).
Fig. 6
Fig. 6
Cross-correlation function between a boxcar representing the task-timing and the signal intensity time course from the lexical task (left) and the breath-holding run (right) averaged over all subjects and various regions of interest: Act ROI — regions significantly activated during the lexical task (i.e. significantly correlated with the ideal BOLD response); Deact ROI — regions significantly deactivated relative to baseline; RVT-noAct ROI: regions significantly correlated with respiration volume per unit time (RVT) changes during resting runs, but outside of regions activated and deactivated. Note: cross-correlations for the Deact ROI and RVT-noAct ROI are negative, and have been multiplied by − 1 for display.
Fig. 7
Fig. 7
(a) Voxels with significant BOLD signal changes (i.e. the average Z-scores of the regressor modeling the ideal BOLD response) across all subjects during the visual stimulation (Vis Only), combined visual stimulation and Breath-holding (Vis + BH), and Breath-holding (BH only) tasks. Fim0: using only the ideal gamma-variate hemodynamic response typically used to model activation. FimRRF: using a gamma-variate hemodynamic response in addition to the respiration response function (RRF). FimROI: using an averaged response from the Vis Only and BH Only conditions to model the visual activation and respiration-induced changes, respectively. (b) Voxels with significant BOLD signal changes (i.e. the average Z-scores of the regressor modeling the ideal BOLD response) across all subjects during the visual stimulation (Vis Only), combined visual stimulation and Breath-holding (Vis + BH), and Breath-holding (BH only) tasks. In addition to the gamma-variate hemodynamics response function used as an ideal function to model the BOLD response, various nuisance regressors are included. FimGR: global regression. FimCSF: signal averaged over CSF. FimSD: time course from voxel with the largest standard deviation over time. FimSD + CSF: both the signal averaged over the CSF and the voxel time course with the highest temporal standard deviation.
Fig. 8
Fig. 8
(a) Activations shown in Fig. 7a, but without thresholding. Average Z-scores of the regressor modeling the ideal BOLD response across all subjects during the visual stimulation (Vis Only), combined visual stimulation and Breath-holding (Vis + BH), and Breath-holding (BH only) tasks. Fim0: using only the ideal gamma-variate hemodynamic response typically used to model activation. FimRRF: using a gamma-variate hemodynamic response in addition to the respiration response function (RRF). FimROI: using an averaged response from the Vis Only and BH Only conditions to model the visual activation and respiration-induced changes, respectively. (b) Activations shown in Fig. 7b, but without thresholding. Average Z-scores of the regressor modeling the ideal BOLD response across all subjects during the visual stimulation (Vis Only), combined visual stimulation and Breath-holding (Vis + BH), and Breath-holding (BH only) tasks. In addition to the gamma-variate hemodynamics response function used as an ideal function to model the BOLD response, various nuisance regressors are included. FimGR: global regression. FimCSF: signal averaged over CSF. FimSD: time course from voxel with the largest standard deviation over time. FimSD + CSF: both the signal averaged over the CSF and the voxel time course with the highest temporal standard deviation.
Fig. 9
Fig. 9
Random effects analysis of signal changes significantly correlated (p < 0.01, corrected) with the ideal BOLD regressor (a gamma-variate response function convolved with the task timing) during visual stimulation alone (Vis only), visual stimulation synchronous with breath-holding (Vis + BH) and breath-holding task alone (BH only). In this random effects analysis, only the amplitudes of the fit to the ideal response are passed to the second level group analysis.
Fig. 10
Fig. 10
Components and associated time courses from a group independent component analysis of all subjects viewing a contrast reversing checkerboard (Visual Only), or viewing a contrast reversing checkerboard while performing a breath-hold synchronous with the visual stimulus (Vis + BH). Two components from the Vis + BH are shown. Component 1 likely reflects respiration induced changes, since these are largest in the sagittal sinus. The time course associated with component 1 (respiration) is delayed relative to the time course associated with component 3 (visual activation). The component reflecting visual activation is highly similar in the presence or absence of task-correlated breath-holding.
Fig. 11
Fig. 11
(a) Average time courses for visual only, Vis + BH, and Breath-hold only conditions, averaged over all subjects and over the visual cortex. (b) The difference between the combined visual stimulation + BH response and the Breath-hold Only response (solid black line) compared to the Visual Only response (dashed red line). (c) The difference between the combined visual stimulation + BH response and the Visual Only response (solid black line) compared to the Breath-hold Only response.

References

    1. Abbott DF, Opdam HI, Briellmann RS, Jackson GD. Brief breath holding may confound functional magnetic resonance imaging studies. Hum. Brain Mapp. 2005;24(4):284–290. - PMC - PubMed
    1. Aguirre GK, Zarahn E, D'Esposito M. The inferential impact of global signal covariates in functional neuroimaging analyses. Neuroimage. 1998;8(3):302–306. - PubMed
    1. Beckmann CF, Smith SM. Probabilistic independent component analysis for functional magnetic resonance imaging. IEEE Trans. Med. Imaging. 2004;23(2):137–152. - PubMed
    1. Bianciardi M, Fukunaga M, van Gelderen P, Horovitz SG, de Zwart J, Shmueli K, Duyn JH. ISMRM Workshop: High Field Systems and applications. Rome, Italy: 2008a. Sources of fMRI signal variance in the human brain at rest: a 7 T study.
    1. Bianciardi M, Fukunaga M, van Gelderen P, Horovitz SG, de Zwart JA, Duyn JH. Modulation of spontaneous fMRI activity in human visual cortex by behavioral state. Neuroimage. 2009;45(1):160–168. - PMC - PubMed

Publication types