. 2009 Aug;37(8):1611-21.
doi: 10.1124/dmd.109.027565. Epub 2009 May 21.

Rifampicin-activated human pregnane X receptor and CYP3A4 induction enhance acetaminophen-induced toxicity

Affiliations

Rifampicin-activated human pregnane X receptor and CYP3A4 induction enhance acetaminophen-induced toxicity

Jie Cheng et al. Drug Metab Dispos. 2009 Aug.

Abstract

Acetaminophen (APAP) is safe at therapeutic levels but causes hepatotoxicity via N-acetyl-p-benzoquinone imine-induced oxidative stress upon overdose. To determine the effect of human (h) pregnane X receptor (PXR) activation and CYP3A4 induction on APAP-induced hepatotoxicity, mice humanized for PXR and CYP3A4 (TgCYP3A4/hPXR) were treated with APAP and rifampicin. Human PXR activation and CYP3A4 induction enhanced APAP-induced hepatotoxicity as revealed by hepatic alanine aminotransferase (ALT) and aspartate aminotransferase (AST) activities elevated in serum, and hepatic necrosis after coadministration of rifampicin and APAP, compared with APAP administration alone. In contrast, hPXR mice, wild-type mice, and Pxr-null mice exhibited significantly lower ALT/AST levels compared with TgCYP3A4/hPXR mice after APAP administration. Toxicity was coincident with depletion of hepatic glutathione and increased production of hydrogen peroxide, suggesting increased oxidative stress upon hPXR activation. Moreover, mRNA analysis demonstrated that CYP3A4 and other PXR target genes were significantly induced by rifampicin treatment. Urinary metabolomic analysis indicated that cysteine-APAP and its metabolite S-(5-acetylamino-2-hydroxyphenyl)mercaptopyruvic acid were the major contributors to the toxic phenotype. Quantification of plasma APAP metabolites indicated that the APAP dimer formed coincident with increased oxidative stress. In addition, serum metabolomics revealed reduction of lysophosphatidylcholine in the APAP-treated groups. These findings demonstrated that human PXR is involved in regulation of APAP-induced toxicity through CYP3A4-mediated hepatic metabolism of APAP in the presence of PXR ligands.


Figures

F<sc>ig</sc>. 1.
Fig. 1.
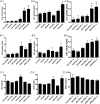
Determination of APAP-induced hepatotoxicity and nephrotoxicity. Two- to 3-month-old TgCYP3A4/hPXR male mice were stratified into six groups: control (Cont), rifampicin treatment (Rif), 200 mg/kg APAP treatment (AP2, intraperitoneal injection), 400 mg/kg APAP treatment (AP4, 400 mg/kg intraperitoneal injection), 200 mg/kg APAP treatment after rifampicin pretreatment (10 mg/kg/day p.o.) for 6 consecutive days (APR2), and 400 mg/kg APAP treatment after rifampicin pretreatment (10 mg/kg/day p.o.) for 6 consecutive days (APR4), respectively. Serum samples were collected 24 h after intraperitoneal injection of 200 and 400 mg/kg APAP. The data are expressed as the mean ± S.D. (n = ≥6; *, p < 0.05; **, p < 0.01; ***, p < 0.001). A, ALT activity (units per milliliter) was measured, with 20-fold elevation of ALT activity between APR2 and AP2 (p < 0.005) and 40-fold elevation between APR4 and AP4 (p < 0.001). B, AST activity (units per milliliter) was measured, with 4-fold elevation of ALT activity between APR2 and AP2 (p < 0.05) and 5-fold elevation between APR4 and AP4 (p < 0.01). C, BUN level (milligrams per deciliter) was detected, with statistical significant differences detected between APR4 and controls.
F<sc>ig</sc>. 2.
Fig. 2.
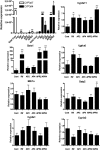
Determination of APAP toxicity in hPXR, wild-type, and Pxr-null mice after rifampicin and APAP treatment. hPXR, wild-type, and Pxr-null mice were separated into groups and administered drugs as detailed under Materials and Methods. Serum samples were collected 24 h after intraperitoneal injection of vehicle, 200 mg/kg APAP, and 400 mg/kg APAP. The data are expressed as the mean ± S.D. (n = ≥6; *, p < 0.05; **, p < 0.01). Cont (hPXR), control (A-1, B-1, C-1); Rif (hPXR), rifampicin treatment alone; AP2 (hPXR), 200 mg/kg APAP treatment, AP4 (hPXR), 400 mg/kg APAP treatment, APR2 (hPXR), 200 mg/kg APAP treatment after rifampicin pretreatment (10 mg/kg/day) for 6 consecutive days; APR4 (hPXR), 400 mg/kg APAP treatment after rifampicin pretreatment (10 mg/kg/day) for 6 consecutive days; Cont (WT), wild-type (WT) control (A-2, B-2, C-2); Rif (WT), rifampicin treatment alone, AP2 (WT), 200 mg/kg APAP treatment, AP4 (WT), 400 mg/kg APAP treatment, APR2 (WT), 200 mg/kg APAP treatment after rifampicin pretreatment (10 mg/kg/day) for 6 consecutive days; APR4 (WT), 400 mg/kg APAP treatment after rifampicin pretreatment (10 mg/kg/day) for 6 consecutive days; Cont (PXR–/–), control Pxr-null mice (A-3, B-3, C-3); Rif (PXR–/–), rifampicin treatment alone; AP2 (PXR–/–), 200 mg/kg APAP treatment; AP4 (PXR–/–), 400 mg/kg APAP treatment; APR2 (PXR–/–), 200 mg/kg APAP treatment after rifampicin pretreatment (10 mg/kg/day) for 6 consecutive day; APR4 (PXR–/–), 400 mg/kg APAP treatment after rifampicin pretreatment (10 mg/kg/day) for 6 consecutive days.
F<sc>ig</sc>. 3.
Fig. 3.
Analysis of APAP-induced oxidative stress. TgCYP3A4/hPXR male mice were stratified into groups as in Fig. 1. A, total hepatic GSH/oxidized glutathione level (nanomoles per milligram of liver) in time course profiles of 1, 2, 4, and 8 h in Cont, Rif, AP2, AP4, APR2, and APR4 mice after APAP administration. One-way analysis of variance analysis showed the differences between six groups in time points of 1, 2, and 4 h. B, aqueous H2O2 concentrations rose in serum upon APAP and rifampicin coadministration between APR2 and AP2 (p < 0.05) or APR4 and AP4 (p < 0.005). The mean ± S.D. is shown (n = 3–4; *, p < 0.05; **, p < 0.01; ***, p < 0.001).
F<sc>ig</sc>. 4.
Fig. 4.
mRNA analysis after APAP administration and PXR activation. Expression of mRNAs encoding CYP3A4, CYP3A7, Cyp3a11, Gsta1, Ugt1a6, Mdr1a, Oatp2, Cyp2e1, and Cyp1a2 were determined by qPCR. TgCYP3A4/hPXR male mice were stratified into groups as in the legend to Fig. 1. Liver tissues were collected 24 h after APAP injection, and RNA was extracted. Mouse β-actin mRNA served as an internal control. The mean ± S.D. is shown (n = ≥6; * for p < 0.05; ** for p < 0.01; *** for p < 0.001, compared with the corresponding control). Among these, relative expressions of CYP3A4 and CYP3A7 were normalized with a ΔCT value of adult CYP3A7 expression as 1. Statistical analysis of CYP3A7 and CYP3A4 expression was compared with the nontreatment group as a control. Other genes were normalized with a ΔCT value of control expression as 1 and statistically compared with the nontreatment group as a control.
F<sc>ig</sc>. 5.
Fig. 5.
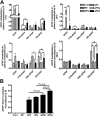
Hepatic CYP3A4 expression in TgCYP3A4/hPXR mice by Western blot evaluation and CYP3A activity in liver microsomes. Liver tissues were collected from six groups (Cont, Rif, AP2, AP4, APR2, and APR4) of transgenic male mice. Liver microsomes were prepared by differential centrifugation. Pooled microsomal samples (n = ≥6 livers in each group, 15 μg of total loading proteins) were used for Western blot analysis. A, the monoclonal antibody against CYP3A4 (275-1-2) specifically recognizes human CYP3A4 but not mouse Cyp3a or other liver proteins. GAPDH was used as a loading control. HLM, human liver microsome. B, CYP3A-involved MDZ 1′-hydroxylation was used as the probe for CYP3A activity and detected by LC-coupled tandem mass spectrometry. Ketoconazole (2 μM) was added to inhibit CYP3A activity. 6-Chloromelatonin was loaded as internal standard. The mean ± S.D. is shown (n = ≥6; ***, p < 0.001, compared with the control group).
F<sc>ig</sc>. 6.
Fig. 6.
Distribution of APAP and its metabolites in urine. TgCYP3A4/hPXR male mice were stratified into groups as in Fig. 1. Urine samples were obtained from preinjection controls of AP2, AP4, APR2, and APR4 and after APAP injection of AP2, AP4, APR2, and APR4 mouse groups. Urinary metabolite profiles were measured by using UPLC-TOFMS, data processing was performed by using MarkerLynx software, and principal components analysis was performed using SIMCA-P+ software. A, scores plot of a PCA model on 24-h urine samples from the preinjection control and after APAP injection of AP2, AP4, APR2, and APR4 group mice. A two-component PCA model was constructed to characterize the relationship among eight mouse groups (3–4 mice/group), including the preinjection control of AP2 ▵, AP4 ⋄, APR2 ▿, and APR4 ○ and after APAP injection of AP2 ▴, AP4 ♦, APR2 ▾, and APR4 • group mice. The t[1] and t[2] values represent the scores of each sample in principal component 1 and 2, respectively. Fitness (R2) and prediction power (Q2) of this PCA model are 0.594 and 0.307, respectively. B, quantitative analysis of major APAP metabolites in control and APAP-treated urine samples. Debrisoquine was loaded as an IS. APAP and major APAP metabolites shown are as follows: I, Cys-APAP; II, APAP; III, NAC-APAP; IV, APAP glucuronide; V, SAMP; VI, APAP sulfate. The mean ± S.D. is shown (n = 3–4; *, p < 0.05). C, loadings plot of chemical ions from 24-h urine samples. The p[1] and p[2] values represent the contributing weights of each ion to principal components 1 and 2 of the PCA model, respectively. Major APAP metabolites (I–VI) contribute to the separation of the control and APAP-induced low hepatotoxicity group mice from APAP-induced high hepatotoxicity mice.
F<sc>ig</sc>. 7.
Fig. 7.
Quantification of major APAP metabolites in serum. TgCYP3A4/hPXR male mice were stratified into groups as in Fig. 1. Serum was obtained from 1, 2, 4, 8, and 24 h after APAP treatment. The metabolite profile was analyzed by using UPLC-QTOFMS, and data processing was performed by using MetaboLynx software. A, venous blood was obtained 1, 2, 4, and 8 h after APAP administration. Abundance of APAP, Cys-APAP, NAC-APAP, and GS-APAP were described from 1, 2, 4, and 8 h, respectively. B, the APAP dimer displayed a significant increase from APR4 to AP4 24 h after the APAP injection. The mean ± S.D. is shown (n = 3–4; *, p < 0.05; **, p < 0.01; ***, p < 0.001).
F<sc>ig</sc>. 8.
Fig. 8.
Analysis of APAP-treated serum through LC-MS-based metabolomics. A, scores plot of a PLS-DA model on 1-, 2-, 4-, and 8-h serum samples from AP2, AP4, APR2, and APR4 mice. A two-component PLS-DA model was constructed to characterize the relationship among four mouse groups (four mice per group), including APAP single-treated mice (⋄, AP2; ▵, AP4); and APAP/rifampicin coadministration mice (♦, APR2; ▴, APR4). The t[1] and t[2] values represent the scores of each sample in principal component 1 and 2, respectively. Fitness (R2) and prediction power (Q2) of this PLS-DA model are 0.301 and 0.366, respectively. B, loadings plot of chemical ions from 1-, 2-, 4-, and 8-h serum samples. The w*c[1] and w*c[2] values represent the contributing weights of each ion to principal components 1 and 2 of the PLS-DA model, respectively. Major ions contributing to the separation of wild-type mice treated with 400 mg/kg APAP/rifampicin from other mouse groups are labeled as C20:4-LPC, C18:0-LPC, C20:3-LPC, C22:6-LPC, and C18:3-LPC, respectively. C, relative abundance of AA (C20: 4-LPC) in serum normalized by the internal standard. The value of AA in each group was an average of the contents of 1, 2, 4, and 8 h. Debrisoquine was loaded as the internal standard. The mean ± S.D. is shown (n = 12; ***, p < 0.001).

References

    1. Adibhatla RM and Hatcher JF (2008) Phospholipase A2, reactive oxygen species, and lipid peroxidation in CNS pathologies. BMB Rep 41 560–567. - PMC - PubMed
    1. Afonso V, Champy R, Mitrovic D, Collin P, and Lomri A (2007) Reactive oxygen species and superoxide dismutases: role in joint diseases. Joint Bone Spine 74 324–329. - PubMed
    1. Bijlsma S, Bobeldijk I, Verheij ER, Ramaker R, Kochhar S, Macdonald IA, van Ommen B, and Smilde AK (2006) Large-scale human metabolomics studies: a strategy for data (pre-) processing and validation. Anal Chem 78 567–574. - PubMed
    1. Blumberg B, Sabbagh W Jr, Juguilon H, Bolado J Jr, van Meter CM, Ong ES, and Evans RM (1998) SXR, a novel steroid and xenobiotic-sensing nuclear receptor. Genes Dev 12 3195–3205. - PMC - PubMed
    1. Carlquist JF, Muhlestein JB, and Anderson JL (2007) Lipoprotein-associated phospholipase A2: a new biomarker for cardiovascular risk assessment and potential therapeutic target. Expert Rev Mol Diagn 7 511–517. - PubMed

Publication types

MeSH terms