. 2009 Dec;50(12):2486-501.
doi: 10.1194/jlr.M900216-JLR200.

The chemical chaperone 4-phenylbutyrate inhibits adipogenesis by modulating the unfolded protein response

Affiliations

The chemical chaperone 4-phenylbutyrate inhibits adipogenesis by modulating the unfolded protein response

Sana Basseri et al. J Lipid Res. 2009 Dec.

Abstract

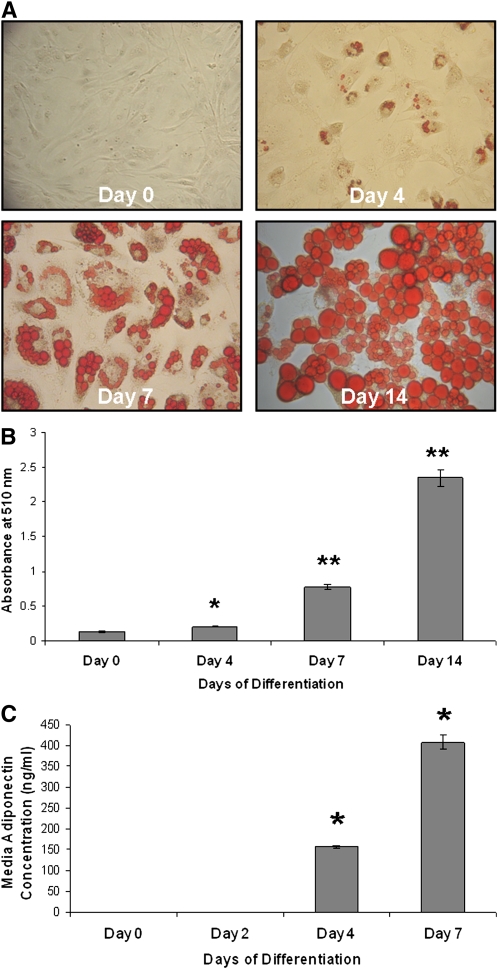
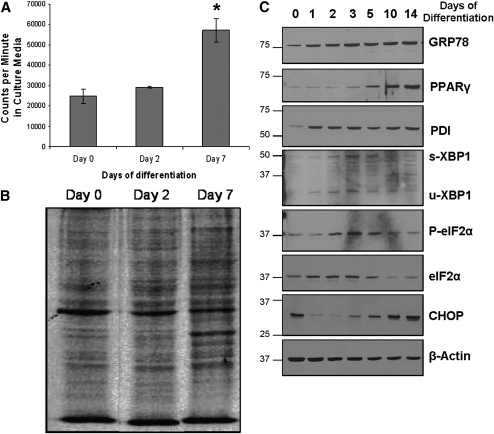
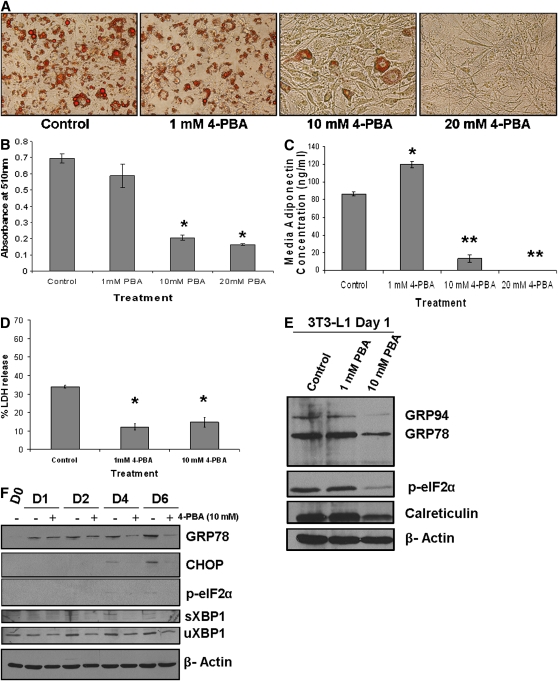
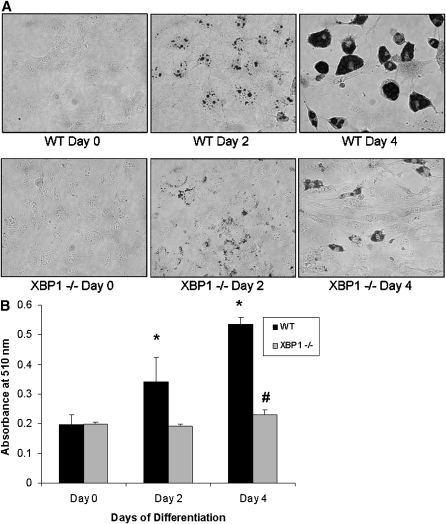
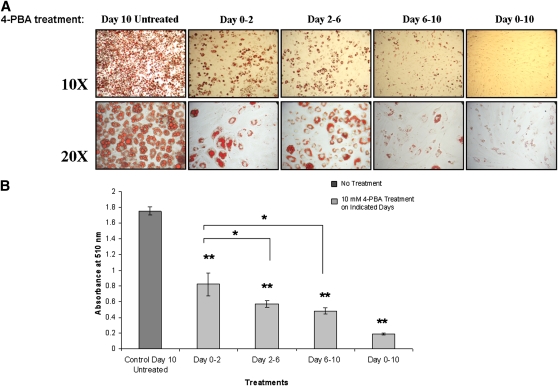
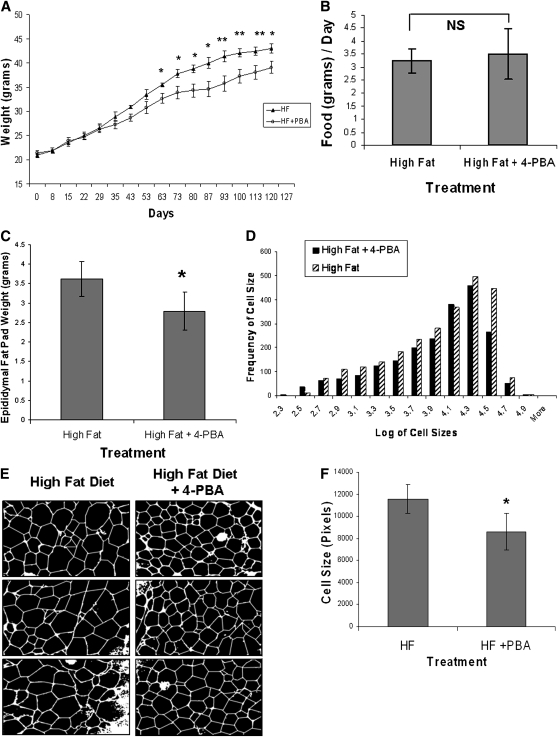
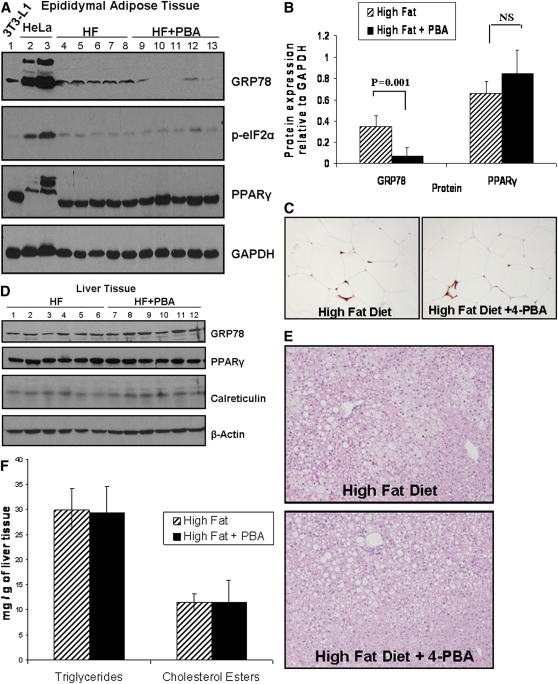
Recent studies have shown a link between obesity and endoplasmic reticulum (ER) stress. Perturbations in ER homeostasis cause ER stress and activation of the unfolded protein response (UPR). Adipocyte differentiation contributes to weight gain, and we have shown that markers of ER stress/UPR activation, including GRP78, phospho-eIF2, and spliced XBP1, are upregulated during adipogenesis. Given these findings, the objective of this study was to determine whether attenuation of UPR activation by the chemical chaperone 4-phenylbutyrate (4-PBA) inhibits adipogenesis. Exposure of 3T3-L1 preadipocytes to 4-PBA in the presence of differentiation media decreased expression of ER stress markers. Concomitant with the suppression of UPR activation, 4-PBA resulted in attenuation of adipogenesis as measured by lipid accumulation and adiponectin secretion. Consistent with these in vitro findings, female C57BL/6 mice fed a high-fat diet supplemented with 4-PBA showed a significant reduction in weight gain and had reduced fat pad mass, as compared with the high-fat diet alone group. Furthermore, 4-PBA supplementation decreased GRP78 expression in the adipose tissue and lowered plasma triglyceride, glucose, leptin, and adiponectin levels without altering food intake. Taken together, these results suggest that UPR activation contributes to adipogenesis and that blocking its activation with 4-PBA prevents adipocyte differentiation and weight gain in mice.


Figures

Fig. 1.
Fig. 1.
Lipid accumulation and adiponectin secretion increase during adipocyte differentiation. A: Lipid accumulation increases with differentiation of 3T3-L1 cells. 3T3-L1 cells grown to confluence were differentiated in growth media containing MDI. Cells were washed in PBS, fixed with 3.7% formaldehyde, stained with Oil red O for 1 h, and photographed on day 0 (preadipocytes) and days 4, 7, and 14 of differentiation. B: Quantification of Oil red O staining in differentiating 3T3-L1 cells. Oil red O was extracted from the cells using 60% isopropanol and collected, and the absorbance was measured at 510 nm from cells on days 0, 4, 7, and 14 of differentiation (*P < 0.0005, **P < 0.00001 compared with day 0; n = 3). C: Adiponectin secretion from 3T3-L1 cells increases significantly following differentiation. 3T3-L1 cells were grown to confluence and cultured in differentiation media. Media were collected on days 0, 2, 4, and 7, and adiponectin levels were measured using ELISA. Concentrations in the samples were determined using a standard curve (*P ≤ 0.000001 compared with day 0; n = 3).
Fig. 2.
Fig. 2.
UPR activation correlates with increased de novo protein synthesis during adipocyte differentiation. A: Differentiating 3T3-L1 cells display increased de novo protein synthesis and secretion. 3T3-L1 cells on days 0, 2, and 7 of differentiation were cultured for 4 h in cysteine/methionine-free media containing 35S-methionine, washed, and incubated overnight in cysteine/methionine-free media. Media were collected the next day, and counts per minute of radioactivity were measured using a scintillation counter (*P ≤ 0.001 compared with day 0; n = 3). B: Total protein lysates from the 35S-labeling experiment were collected, and equivalent concentrations were loaded onto a 10% SDS polyacrylamide gel. The gel was subsequently dried and exposed to X-ray film for 48 h. The autoradiogram is shown here. C: Upregulation of ER stress/UPR markers occurs during 3T3-L1 differentiation. Cells were allowed to differentiate up to 14 days, and total protein lysates were collected in SDS lysis buffer at various time points. Protein was quantified using a Lowry protein assay, and equivalent amounts (30 µg) of protein were loaded into each well. Western blotting was performed to detect the following ER stress/UPR markers: GRP78, PDI, spliced and unspliced XBP1, phosphorylated and total eIF2α, and CHOP. Blots were also probed for PPARγ (marker of adipocyte differentiation) and β-actin to control for protein loading.
Fig. 3.
Fig. 3.
Treatment of 3T3-L1 cells with 4-PBA inhibits UPR activation and blocks differentiation in a dose-dependent manner. A: Inhibition of Oil red O staining in differentiating 3T3-L1 cells by 4-PBA. Confluent 3T3-L1 cells were cultured in differentiation media with increasing concentrations of 4-PBA. On day 5, cells were fixed and stained with Oil red O. Representative images of Oil red O-stained cells are shown for each condition. B: Quantification of Oil red O indicates a significant decrease in lipid droplets with 4-PBA treatment. Following extraction and collection of Oil red O in isopropanol, absorbance was measured at 510 nm (*P < 0.001 compared with control; n = 3). C: Adiponectin secretion of 3T3-L1 cells is inhibited by 4-PBA. Media were collected on day 5 of differentiation, and adiponectin levels were measured using an ELISA (*P ≤ 0.0005, **P ≤ 0.00001 compared with control; n = 3). D: 4-PBA treatment is not cytotoxic to 3T3-L1 cells. Confluent 3T3-L1 cells were treated with 1 or 10 mM 4-PBA in 1% FBS media for up to 48 h. Media were collected, and LDH release was measured (*P < 0.0005; n = 3). E: Downregulation of UPR markers in 3T3-L1 cells following treatment with 4-PBA. Confluent 3T3-L1 cells were treated with 1 or 10 mM 4-PBA. After 24 h, total cell lysates were collected and run on a 10% SDS polyacrylamide gel. Antibodies against KDEL (to detect GRP78 and GRP94), calreticulin, phospho-eIF2α, or β-actin were used for Western blotting. F: Differentiation of 3T3-L1 cells in the presence of 4-PBA suppresses GRP78 expression. 3T3-L1 cells were stimulated to differentiate in the presence or absence of 10 mM 4-PBA. Protein was collected on day 0 (confluent cells with no 4-PBA treatment) or days 1, 2, 4, and 6 of differentiation, and Western blotting was used to detect GRP78, CHOP, phospho-eIF2α, and spliced XBP1. As a loading control, the membrane was probed for β-actin.
Fig. 4.
Fig. 4.
XBP1-deficient MEFs have reduced adipogenic potential. A: Xbp1−/− MEFs exhibit impaired adipogenesis. Wild-type (WT) or Xbp1−/− MEFs were stimulated to differentiate into adipocytes for 4 days. Cells on days 0, 2, or 4 of differentiation were fixed and stained with Oil red O. B: Quantification of Oil red O staining. Wild-type MEFs accumulate lipid and demonstrate a significant increase in Oil red O staining, while deficiency of XBP1 prevents lipid accumulation (*P < 0.01 compared with wild-type day 0 cells, #P < 0.05 compared with day 0 Xbp1−/− MEFs; n = 6).
Fig. 5.
Fig. 5.
4-PBA inhibits lipid accumulation during all stages of differentiation. A: Effect of 4-PBA on Oil red O staining in differentiating 3T3-L1 cells. 3T3-L1 cells were treated with 10 mM 4-PBA at the onset of differentiation in the presence of MDI (days 0–2), during mid-stages after the MDI was removed (days 2–6), and during late stages after the majority of cells had differentiated (days 6–10). All cells were fixed and stained with Oil red O 10 days after commencing the experiment. As controls, cells were treated in the presence or absence of 4-PBA from days 0–10. B: Quantification of Oil red O staining in the absence or presence of 4-PBA at all stages of adipogenesis. Oil red O stain was quantified, and a significant reduction in lipid accumulation in all conditions was observed with 4-PBA treatment compared with day 10 untreated control (**P < 0.001; n = 3). The decline in lipid content was most dramatic in cells treated with 4-PBA during the later stages of adipogenesis: on days 2–6 or 6–10 (*P < 0.05 compared with days 0–2).
Fig. 6.
Fig. 6.
Effect of 4-PBA on weight gain and adipogenesis in mice fed a high-fat diet. C57BL/6 mice were fed a high-fat diet supplemented without (n = 8) or with 4-PBA (n = 9) at a dose of 1g/kg/day. A: Effect of 4-PBA on weight gain. Starting at day 63 and for the remainder of the study, mice supplemented with 4-PBA had significantly lower body weights compared with controls (*P ≤ 0.05, **P ≤ 0.01 compared with the mice supplemented with 4-PBA using a rank sum test of significance; n = 8–9). B: Food intake measurements. No significant difference in food intake was noted between the two groups. C: Effect of 4-PBA on epididymal fat mass. Epididymal fat pads were removed at the conclusion of the study and weighed. Mice on the high fat + 4-PBA diet had significantly lower mean fat pad mass (*P < 0.01 using a rank sum test of significance; n = 8–9). D: Adipocyte cell size distribution from epididymal adipose tissue of C57BL/6 mice. The histograms represent the distribution of cell sizes in mice fed a high-fat diet with or without 4-PBA supplementation. The x axis represents the logarithm of cell sizes in pixels, while the y axis shows the frequency of a given cell size in the population of cells for each group of mice. E: Representative cross sections of epididymal fat pads. Images of the sectioned tissue were taken, and representative pictures from the two groups of mice are shown. F: Mean adipocyte size is reduced with 4-PBA supplementation. Mice fed a high-fat diet supplemented with 4-PBA had a significant reduction in average cell size compared with the high-fat diet alone group (*P < 0.05). For average cell size measurements, n = 5 for the high-fat group and n = 4 for the high-fat + 4-PBA group.
Fig. 7.
Fig. 7.
4-PBA treatment reduces GRP78 expression in the adipose but not liver tissue. A: Protein lysates from the epididymal adipose tissue of mice on high-fat diet (lanes 4–8) or high-fat diet + 4-PBA (lanes 9–13) were separated on a 10% SDS polyacrylamide gel. Membranes were probed for KDEL (to detect GRP78), PPARγ, or phospho-eIF2α. GAPDH was used as a loading control. Differentiated 3T3-L1 cell lystate (lane 1) and protein lysates from HeLa cells treated with the ER stress-inducting agent tunicamycin (lanes 2 and 3) were also loaded as positive controls for PPARγ, GRP78, and phospho-eIF2α expression, respectively. B: Band intensity quantification analysis demonstrated a significant decrease in GRP78 in the adipose tissues of 4-PBA-treated mice (*P = 0.001; n = 5). No significant difference was seen in PPARγ or phospho-eIF2α expression between the two groups of mice. C: Mac-3 staining of the adipose tissue. The epididymal adipose tissue was stained with an antibody against Mac-3 to detect infiltrated macrophages. Representative images are shown. D: Total liver lysates from mice on high-fat diet (lanes 1–6) or high-fat diet + 4-PBA (lanes 7–12) were separated on a 10% SDS polyacrylamide gel. Western blot analysis was used to detect the ER stress markers GRP78 and calreticulin, as well as PPARγ and β-actin. No significant differences were seen between the two groups. E: Detection of fatty liver in mice fed high-fat diet or high-fat diet + 4-PBA. Fixed and paraffin-embedded liver samples were sectioned, deparaffinized, and stained with hematoxylin and eosin. Representative images from each group showed similar degrees of hepatic steatosis. F: Quantification of hepatic triglycerides and cholesterol esters. Approximately 150 mg of frozen liver tissue was homogenized, and triglycerides and cholesterol esters were extracted. No differences in triglyceride or cholesterol ester concentrations were observed between the two groups of mice (n = 4).

Similar articles

Cited by

References

    1. Bray G. A.2004. Medical consequences of obesity. J. Clin. Endocrinol. Metab. 89: 2583–2589 - PubMed
    1. Kosti R. I., Panagiotakos D. B. 2006. The epidemic of obesity in children and adolescents in the world. Cent. Eur. J. Public Health. 14: 151–159 - PubMed
    1. Gregoire F. M., Smas C. M., Sul H. S. 1998. Understanding adipocyte differentiation. Physiol. Rev. 78: 783–809 - PubMed
    1. Erol A.2005. Adipocyte insensitivity syndromes–novel approach to nutritional metabolic problems including obesity and obesity related disorders. Med. Hypotheses. 64: 826–832 - PubMed
    1. de Ferranti S., Mozaffarian D. 2008. The perfect storm: obesity, adipocyte dysfunction, and metabolic consequences. Clin. Chem. 54: 945–955 - PubMed

Publication types

MeSH terms