. 2009 May 27;87(10):1478-87.
doi: 10.1097/TP.0b013e3181a3c691.

Human heat shock protein 27 overexpressing mice are protected against hepatic ischemia and reperfusion injury

Affiliations

Human heat shock protein 27 overexpressing mice are protected against hepatic ischemia and reperfusion injury

Sean W C Chen et al. Transplantation. .

Abstract

Background: Hepatic ischemia reperfusion injury (IRI) is a major clinical problem during the perioperative period and occurs frequently after major hepatic resection or liver transplantation. Our laboratory previously demonstrated that exogenous A1 adenosine receptor activation protects against renal IRI by upregulation and phosphorylation of heat shock protein 27 (HSP27).

Methods: This study used mice overexpressing human HSP27 (huHSP27 OE) to determine whether these mice are protected against liver IRI.

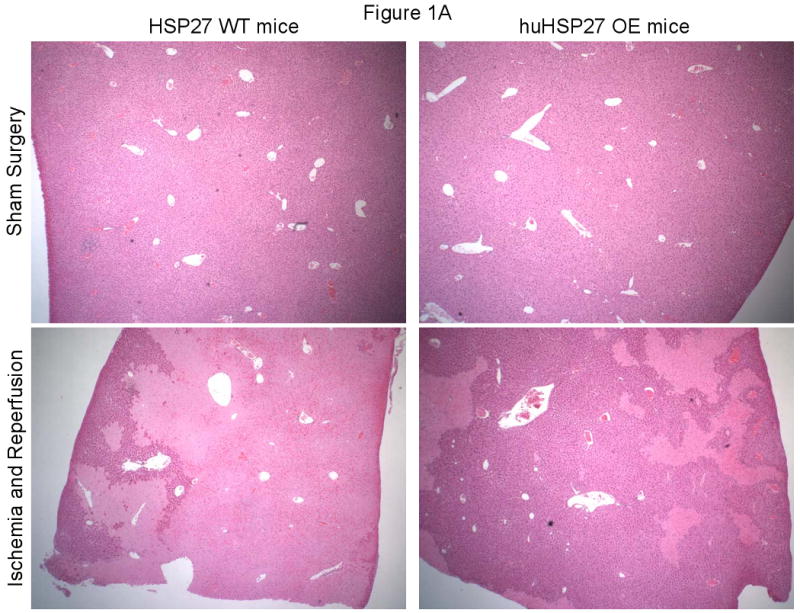
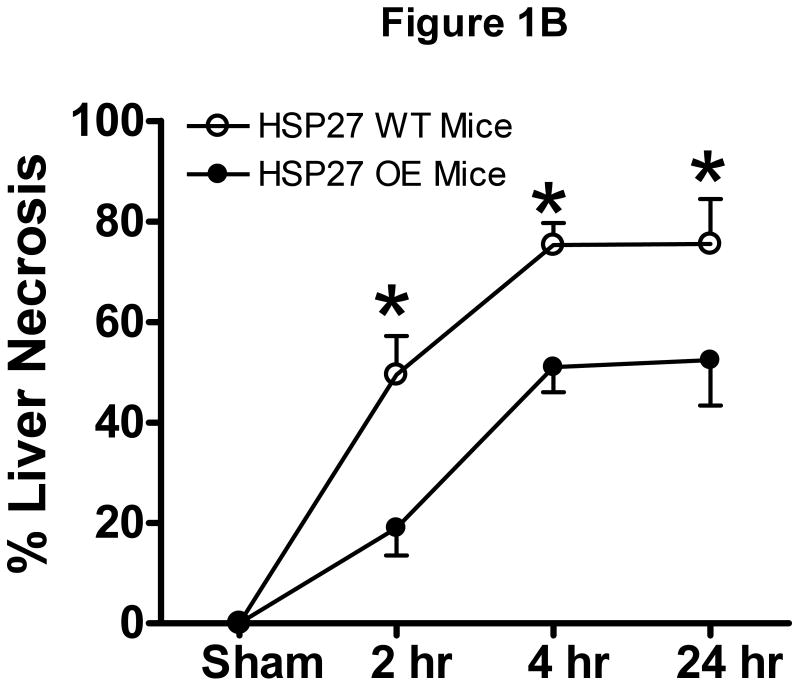
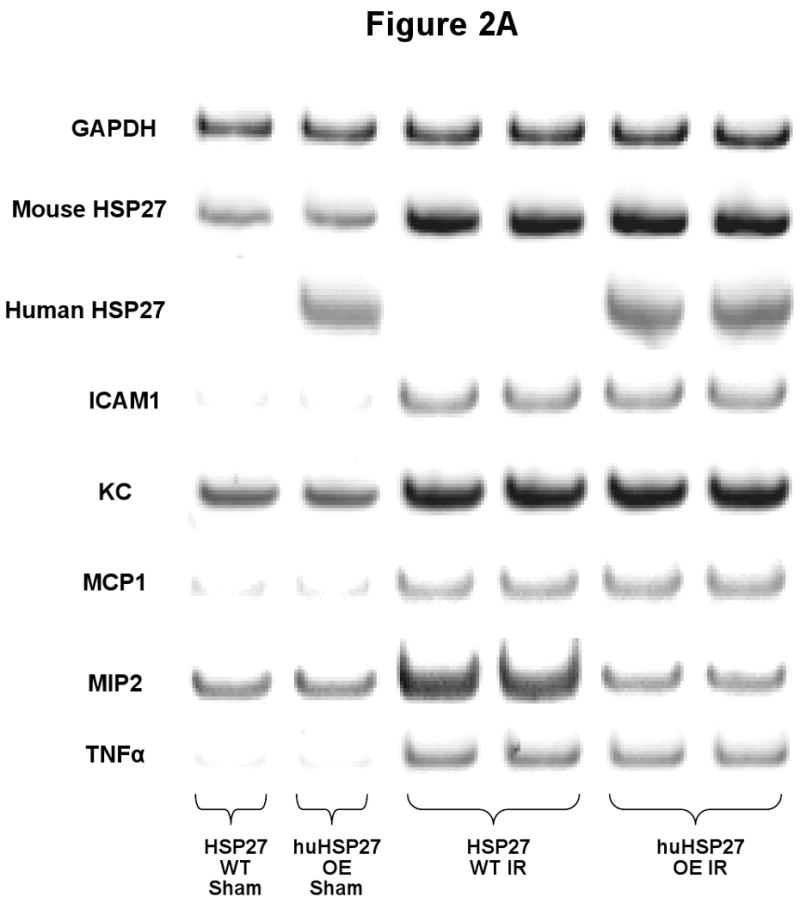
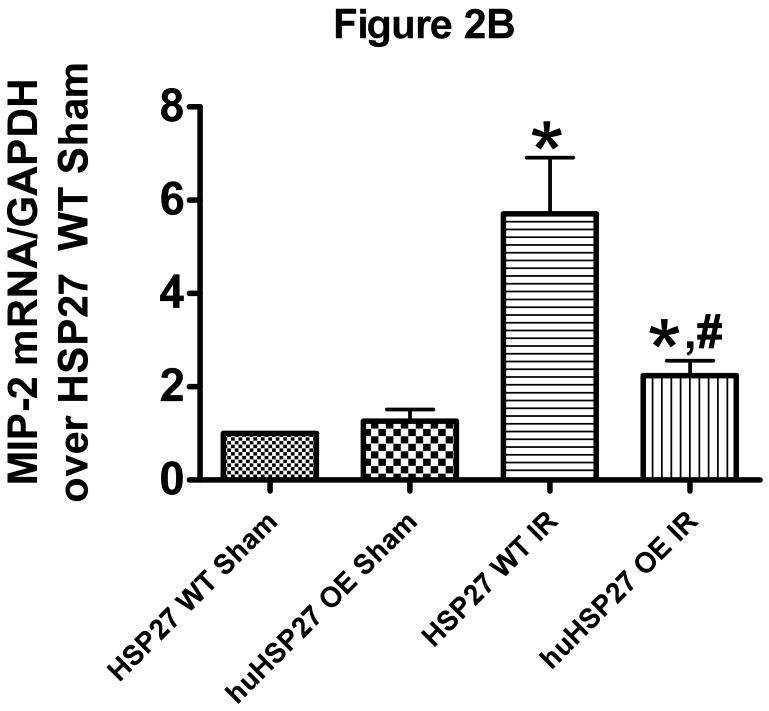
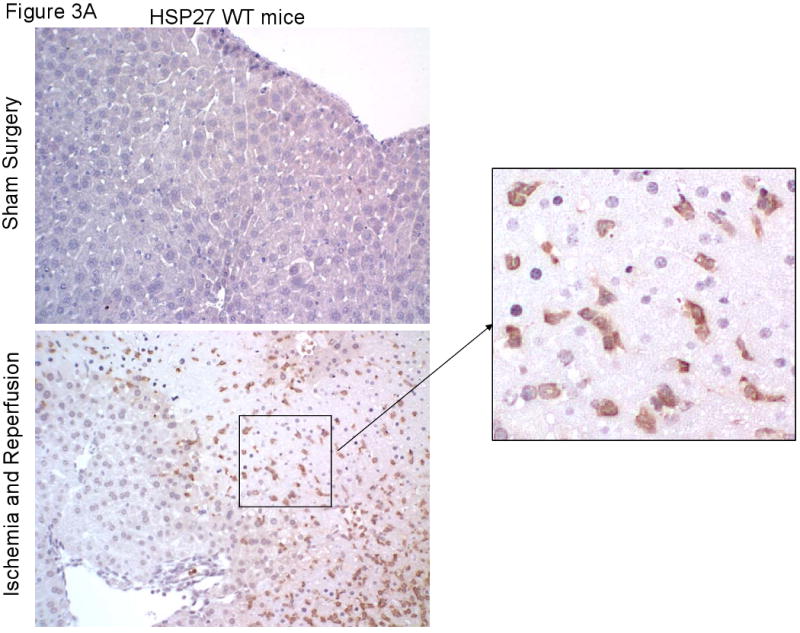
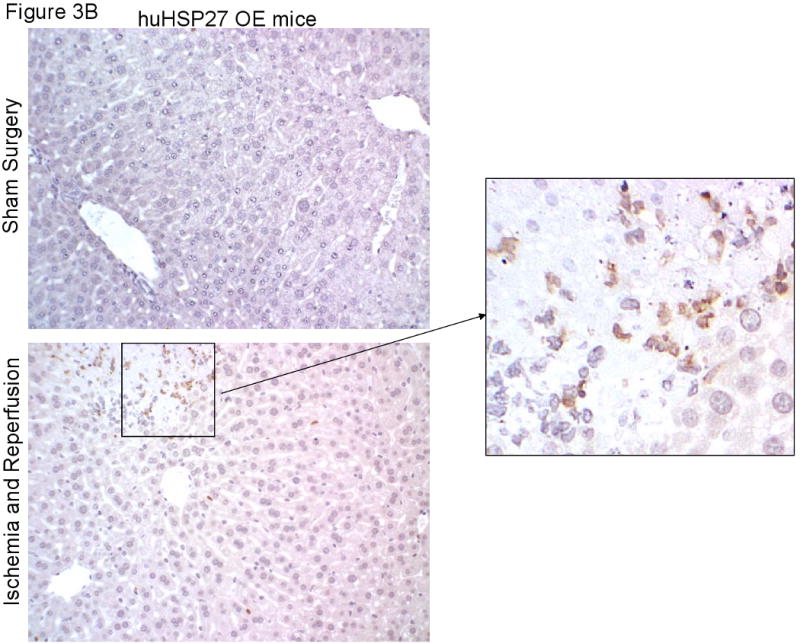
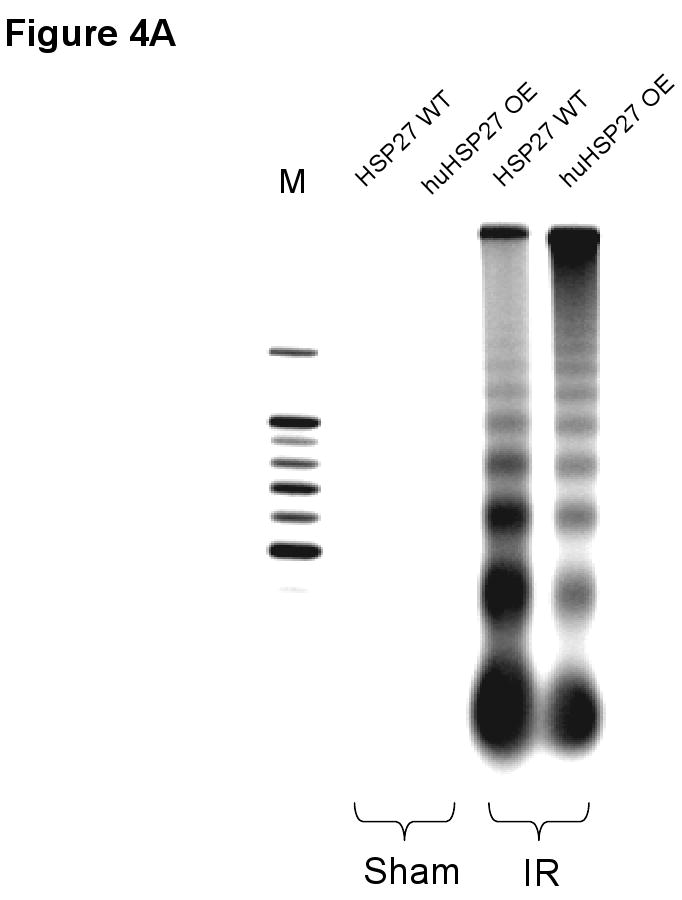
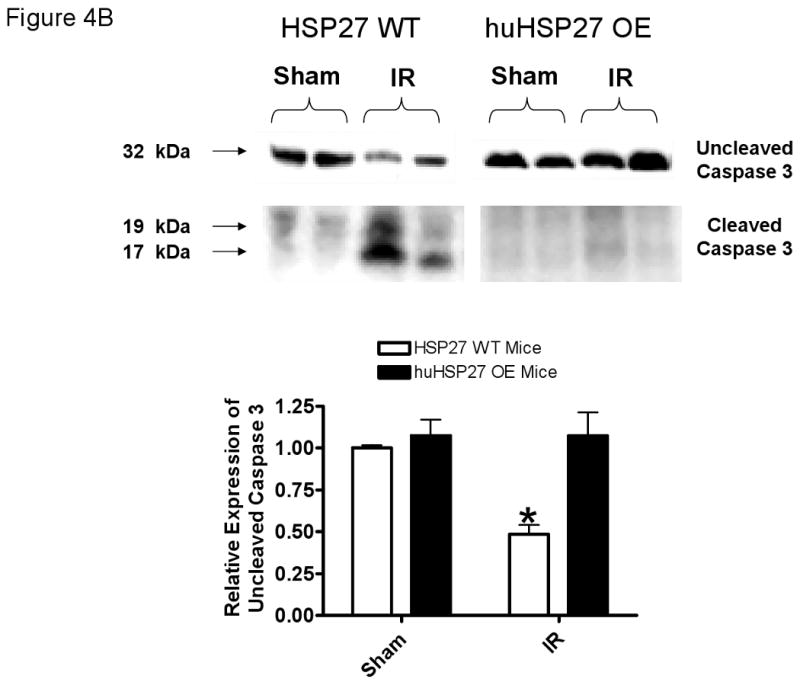
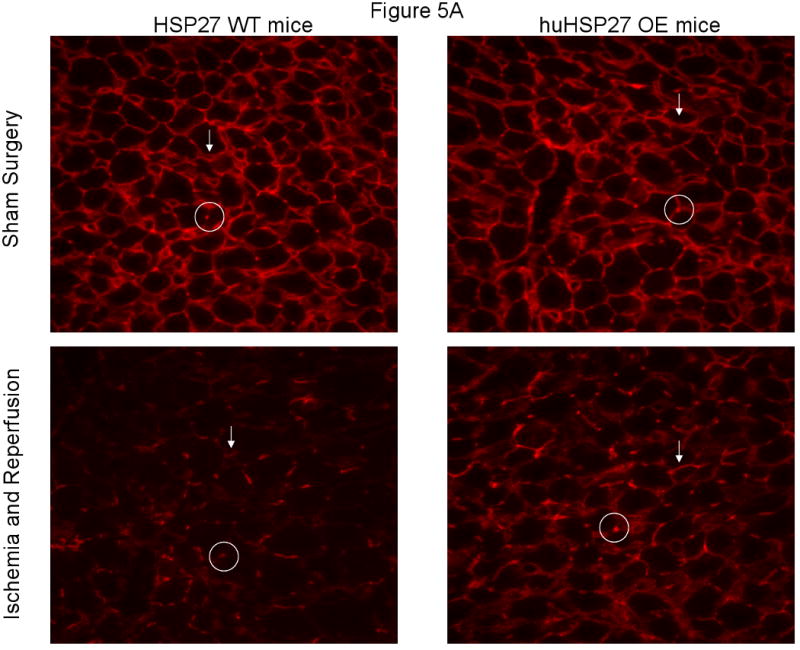
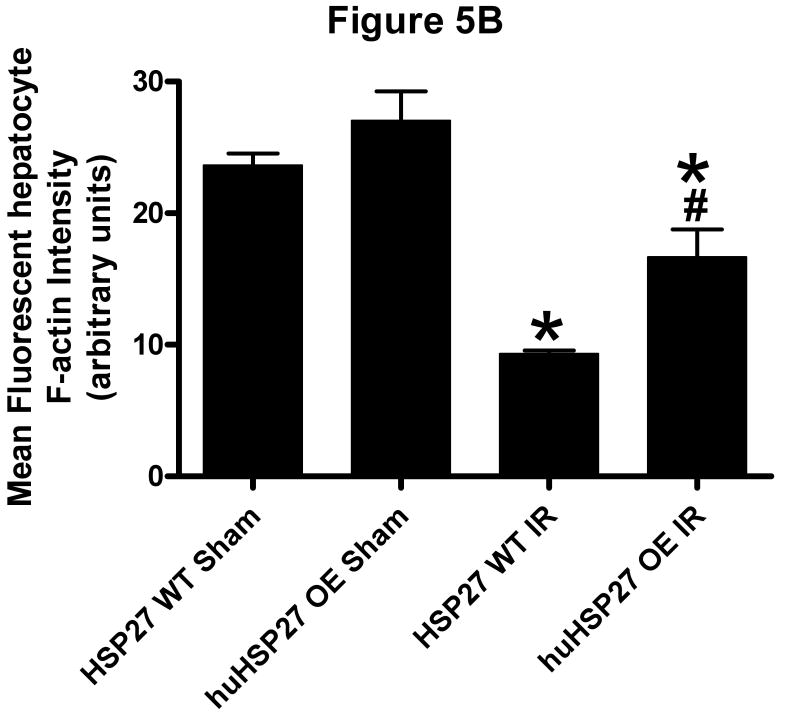
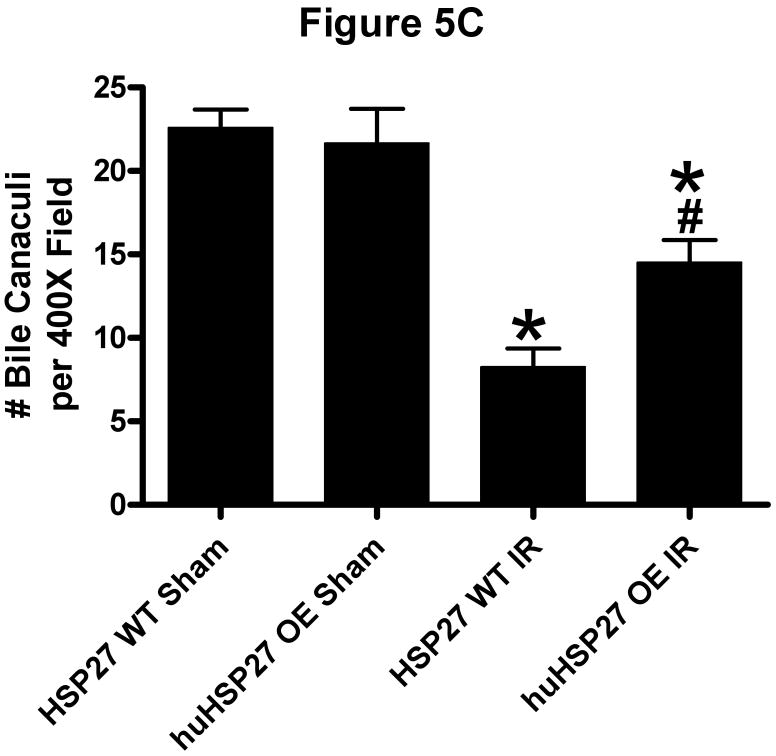
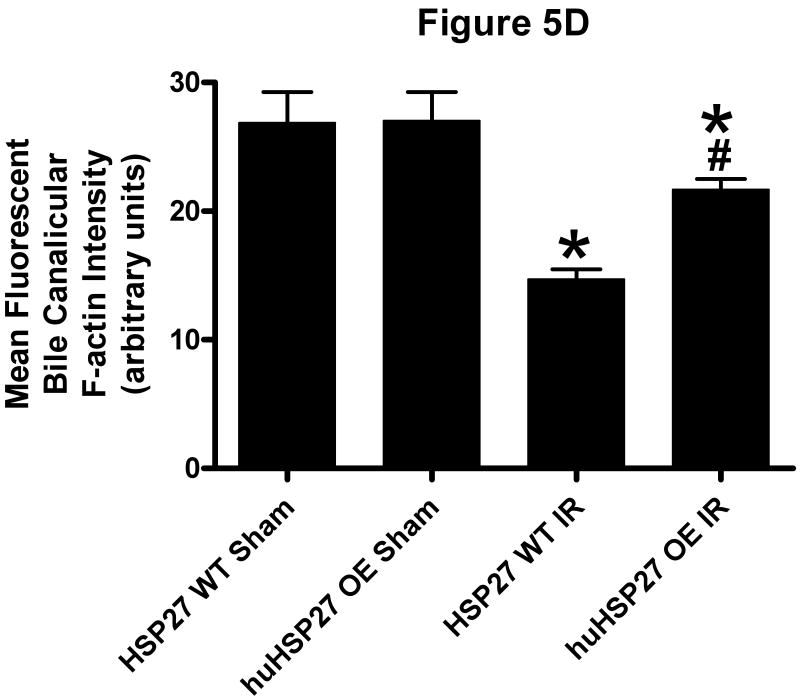
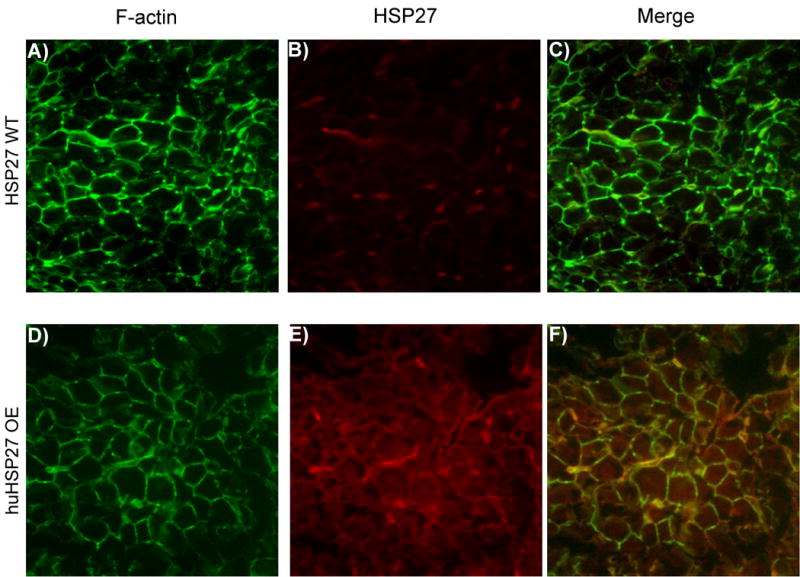
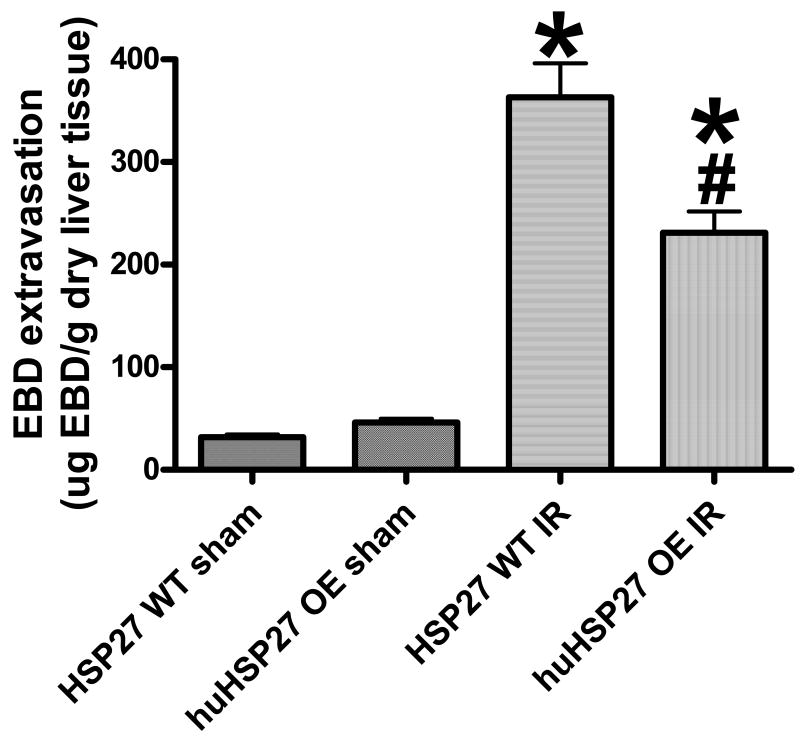
Results: After hepatic IR, the huHSP27 OE mice had significant protection against liver injury (reduced alanine transferase) and necrosis (hematoxylin-eosin staining) compared with the HSP27 WT mice. The huHSP27 OE mice also showed less induction of proinflammatory messenger RNA MIP-2, reduced neutrophil infiltration, and decreased apoptosis (caspase 3 fragmentation and DNA laddering) compared with the HSP27 WT mice. Finally, the huHSP27 OE mice showed significantly less disruption of filamentous actin in hepatocytes and bile canaliculi of the ischemic lobes compared with the HSP27 WT mice. Depletion of Kupffer cells with gadolinium chloride provided significant protection against liver IRI in HSP27 WT mice but not in huHSP27 OE mice suggesting that the overexpression of huHSP27 in the Kupffer cells may be responsible for the hepatic protection observed in huHSP27 OE mice.

Conclusions: Our results show that the overexpression of huHSP27 in Kupffer cells of the liver may be responsible for the protection against hepatic IRI in vivo by reducing necrosis and apoptosis and by stabilizing F-actin with subsequent reductions in inflammation and proinflammatory neutrophil infiltration. Harnessing the mechanisms of cytoprotection with HSP27 may lead to new therapies for the management of perioperative hepatic IRI.


Conflict of interest statement

Conflict of interest statement: We declare that no financial conflict of interest exists for each author.

Figures

Figure 1
Figure 1
A. Representative hematoxylin and eosin staining photomicrographs in liver sections for HSP27 WT and huHSP27 OE mice subjected to sham-operation or to liver IRI (magnification 40×). Necrotic hepatic tissue appears as light pink. B. Quantification of percent necrosis area from sham-operated HSP27 WT and huHSP27 OE mice (HSP27 WT Sham, N=4; huHSP27 Sham, N=4), HSP27 WT or huHSP27 OE mice subjected to hepatic ischemia and 2, 4 or 24 hr of reperfusion (HSP27 WT IR, N=6; huHSP27 OE IR, N=6).
Figure 1
Figure 1
A. Representative hematoxylin and eosin staining photomicrographs in liver sections for HSP27 WT and huHSP27 OE mice subjected to sham-operation or to liver IRI (magnification 40×). Necrotic hepatic tissue appears as light pink. B. Quantification of percent necrosis area from sham-operated HSP27 WT and huHSP27 OE mice (HSP27 WT Sham, N=4; huHSP27 Sham, N=4), HSP27 WT or huHSP27 OE mice subjected to hepatic ischemia and 2, 4 or 24 hr of reperfusion (HSP27 WT IR, N=6; huHSP27 OE IR, N=6).
Figure 2
Figure 2
A. Representative gel images of semi-quantitative RT-PCR of the pro-inflammatory markers ICAM-1, KC, MCP-1, MIP-2 and TNF-α and mouse and human HSP27 from liver tissue of HSP27 WT or huHSP27 OE mice subjected to sham-operation or to liver IR (60 min. ischemia and 4 hr reperfusion). B. Densitometric quantifications of relative band intensities from RT-PCR reactions for MIP-2 mRNA (normalized to GAPDH). Data in bar graphs are means ± SEM. *p < 0.05 vs. HSP27 WT Sham group. #p < 0.01 vs. HSP27 WT IR group.
Figure 2
Figure 2
A. Representative gel images of semi-quantitative RT-PCR of the pro-inflammatory markers ICAM-1, KC, MCP-1, MIP-2 and TNF-α and mouse and human HSP27 from liver tissue of HSP27 WT or huHSP27 OE mice subjected to sham-operation or to liver IR (60 min. ischemia and 4 hr reperfusion). B. Densitometric quantifications of relative band intensities from RT-PCR reactions for MIP-2 mRNA (normalized to GAPDH). Data in bar graphs are means ± SEM. *p < 0.05 vs. HSP27 WT Sham group. #p < 0.01 vs. HSP27 WT IR group.
Figure 3
Figure 3
A: Representative photomicrographs of neutrophil accumulation (dark brown punctate stain) in liver sections (magnification ×200). Few scattered neutrophils are present in sham operated mice. HSP27 WT mice (A) subjected to IR injury exhibited large increases in neutrophil accumulation whereas huHSP27 OE mice (B) showed significantly less neutrophil infiltration (representative of 7 experiments). Inserts show higher magnification of image demonstrating PMN infiltration.
Figure 3
Figure 3
A: Representative photomicrographs of neutrophil accumulation (dark brown punctate stain) in liver sections (magnification ×200). Few scattered neutrophils are present in sham operated mice. HSP27 WT mice (A) subjected to IR injury exhibited large increases in neutrophil accumulation whereas huHSP27 OE mice (B) showed significantly less neutrophil infiltration (representative of 7 experiments). Inserts show higher magnification of image demonstrating PMN infiltration.
Figure 4
Figure 4
huHSP27 OE mice show reduced apoptosis after liver IR compared to HSP27 WT mice. We utilized 2 separate indices to detect apoptosis after sham-operation or liver IR in HSP27 WT or huHSP27 OE mice. A. Representative DNA ladder (of 4 experiments). Apoptotic DNA fragments were separated from intact chromatin and loaded into the agarose gel. B. (top) Representative caspase 3 fragmentation (from 4 experiments). (bottom) Densitometric quantifications of unfragmented caspase 3 (pro-caspase 3) from HSP27 WT and huHSP27 OE mice subjected to sham-operation or liver IR (N=4 for each group). * p<0.05 vs. HSP27 WT Sham group.
Figure 4
Figure 4
huHSP27 OE mice show reduced apoptosis after liver IR compared to HSP27 WT mice. We utilized 2 separate indices to detect apoptosis after sham-operation or liver IR in HSP27 WT or huHSP27 OE mice. A. Representative DNA ladder (of 4 experiments). Apoptotic DNA fragments were separated from intact chromatin and loaded into the agarose gel. B. (top) Representative caspase 3 fragmentation (from 4 experiments). (bottom) Densitometric quantifications of unfragmented caspase 3 (pro-caspase 3) from HSP27 WT and huHSP27 OE mice subjected to sham-operation or liver IR (N=4 for each group). * p<0.05 vs. HSP27 WT Sham group.
Figure 5
Figure 5
A. Representative (of 5 experiments) fluorescent photomicrographs of FITC-phalloidin labeling to visualize F-actin in the liver from HSP27 WT or huHSP27 OE mice subjected to sham-operation or to 60 min. liver ischemia and 24 hr reperfusion (magnification ×400). F-actin is localized in basolateral membranes (arrow) and bile canalicular membranes. Transversal sections of bile canaliculi are seen as typical dots (circle). After liver IR in HSP27 WT mice, the basolateral as well as bile canalicular membrane F-actin stains were reduced and disorganized. B-D. Quantification of mean fluorescent total hepatocyte F-actin intensity (B, N=5), number of intact bile canalicular membranes (C, N=4) and mean fluorescent intensities of bile canalicular membranes (D, N=4) as measures of F-actin preservation in liver sections. *p < 0.05 vs. HSP27 WT Sham group. #p < 0.01 vs. HSP27 WT IR group.
Figure 5
Figure 5
A. Representative (of 5 experiments) fluorescent photomicrographs of FITC-phalloidin labeling to visualize F-actin in the liver from HSP27 WT or huHSP27 OE mice subjected to sham-operation or to 60 min. liver ischemia and 24 hr reperfusion (magnification ×400). F-actin is localized in basolateral membranes (arrow) and bile canalicular membranes. Transversal sections of bile canaliculi are seen as typical dots (circle). After liver IR in HSP27 WT mice, the basolateral as well as bile canalicular membrane F-actin stains were reduced and disorganized. B-D. Quantification of mean fluorescent total hepatocyte F-actin intensity (B, N=5), number of intact bile canalicular membranes (C, N=4) and mean fluorescent intensities of bile canalicular membranes (D, N=4) as measures of F-actin preservation in liver sections. *p < 0.05 vs. HSP27 WT Sham group. #p < 0.01 vs. HSP27 WT IR group.
Figure 6
Figure 6
Representative fluorescent photomicrographs of phalloidin labeling (green, A and D) to visualize F-actin and HSP27 protein immunocytochemistry (red, B and E: antibody recognized both human and mouse form of HSP27) in the livers from HSP27 WT (A, B, C) or huHSP27 OE mice (D, E, F). Note that increased HSP27 expression (red) in huHSP27 OE mice. Moreover, HSP27 and F-actin co-localize together (yellow, C and F) demonstrated with 0.25 μm thickness Z-sections. Representative of 5 independent experiments.
Figure 7
Figure 7
Evans blue dye extravasation as an index of vascular permeability. HSP27 WT or huHSP27 OE mice were subjected to sham-operation (N=4) or to 60 min. liver ischemia and 24 hr reperfusion (N=6 for HSP27 WT mice and N=7 for huHSP27 OE mice). EBD was extracted in formamide and the amount of extravasated EBD concentration in the liver was calculated against a standard curve. *p < 0.05 vs. HSP27 WT Sham group. #p < 0.01 vs. HSP27 WT IR group.

Similar articles

Cited by

References

    1. Teoh NC, Farrell GC. Hepatic ischemia reperfusion injury: pathogenic mechanisms and basis for hepatoprotection. J Gastroenterol Hepatol. 2003;18:891–902. - PubMed
    1. Serracino-Inglott F, Habib NA, Mathie RT. Hepatic ischemia-reperfusion injury. Am J Surg. 2001;181:160–166. - PubMed
    1. Fondevila C, Busuttil RW, Kupiec-Weglinski JW. Hepatic ischemia/reperfusion injury--a fresh look. Exp Mol Pathol. 2003;74:86–93. - PubMed
    1. Savransky V, Molls RR, Burne-Taney M, Chien CC, Racusen L, Rabb H. Role of the T-cell receptor in kidney ischemia-reperfusion injury. Kidney Int. 2006;69:233–238. - PubMed
    1. Frangogiannis NG. Chemokines in ischemia and reperfusion. Thromb Haemost. 2007;97:738–747. - PubMed

Publication types