. 2009 May;5(5):e1000492.
doi: 10.1371/journal.pgen.1000492. Epub 2009 May 22.

Root suberin forms an extracellular barrier that affects water relations and mineral nutrition in Arabidopsis

Affiliations

Root suberin forms an extracellular barrier that affects water relations and mineral nutrition in Arabidopsis

Ivan Baxter et al. PLoS Genet. 2009 May.

Abstract

Though central to our understanding of how roots perform their vital function of scavenging water and solutes from the soil, no direct genetic evidence currently exists to support the foundational model that suberin acts to form a chemical barrier limiting the extracellular, or apoplastic, transport of water and solutes in plant roots. Using the newly characterized enhanced suberin1 (esb1) mutant, we established a connection in Arabidopsis thaliana between suberin in the root and both water movement through the plant and solute accumulation in the shoot. Esb1 mutants, characterized by increased root suberin, were found to have reduced day time transpiration rates and increased water-use efficiency during their vegetative growth period. Furthermore, these changes in suberin and water transport were associated with decreases in the accumulation of Ca, Mn, and Zn and increases in the accumulation of Na, S, K, As, Se, and Mo in the shoot. Here, we present direct genetic evidence establishing that suberin in the roots plays a critical role in controlling both water and mineral ion uptake and transport to the leaves. The changes observed in the elemental accumulation in leaves are also interpreted as evidence that a significant component of the radial root transport of Ca, Mn, and Zn occurs in the apoplast.


Conflict of interest statement

The authors have declared that no competing interests exist.

Figures

Figure 1
Figure 1. Segregation of shoot ionomic phenotype in five week old F2 plants from a Col-0 x esb1-1 backcross.
Data represents the percentage difference from the mean of the wild-type (Col-0) control plants (n = 40). Open circles = wild-type Col-0; grey diamonds = esb1-1; solid squares = F2 plants from a Col-0 x esb1-1 cross. Raw data can be viewed and obtained from www.ionomichub.org in trays 533, 534 and 535.
Figure 2
Figure 2. Segregation of shoot ionomic phenotype in five week old F2 plants from a Ler-0 x esb1-1 outcross.
Data represents the percentage difference from the mean of the wild-type (Col-0) control plants (n = 60). Open circles = wild-type Col-0; grey diamonds = esb1-1; open triangles = Ler-0; solid squares = F2 plants from a Ler-0 x esb1-1 outcross. Raw data can be viewed and obtained from www.ionomichub.org in trays 590, 591, 592, 593 and 594. The ∼100% low Mo accumulation of some of the plants is due the effect of the mot1 Ler locus .
Figure 3
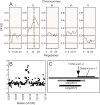
Figure 3. DNA microarray-based BSA, deletion mapping and gene structure of At2g28670.
A. Bulk Segregant analysis of the low shoot Ca and B content in an F2 population from a Ler-0 x esb1-1 outcross. Data are presented as a scaled pool hybridization difference (SPHD), representing the difference between the hybridization of the two pools at the SFPs, scaled so that a pure Col-0 pool would be at 1 and a pure Ler-0 pool would be at −1. The pools were prepared from F2 plants with a low Ca and B content (n = 41) and F2 plants with a Col-0-like Ca and B content (n = 41). SFPs were scored after hybridization of genomic DNA prepared from these pools to Affymetrix ATH1 DNA microarrays. Dotted lines denote likely location of the causal loci. B. Deletion analysis of esb1-1. DNA from esb1-1 and wild-type Col-0 was hybridized to the Affymetrix Arabidopsis ATTILE 1.0R microarray and compared the hybridization at probes which represent sequence between 9 and 13 Mb on chromosome 2. C. Grey line represents chromosome 2 between 12,307,000 and 12,310,000 and shows the open reading frames for At2g28671 and At2g28670 (grey arrow representing the cDNA and the black segment representing the single exon). The black triangle represents the T-DNA insertion at 12,308,657 in line esb1-2 (GABI_858D03), and the solid black line represents the deletion in esb1-1.
Figure 4
Figure 4. Expression pattern of At2g28670.
A. Expression of At2g28670 was analyzed by quantitative real-time RT-PCR in roots and shoots of wild-type, esb1-1 and esb1-2 plants. RNA was isolated from shoot and root of 5 week-old plants grown in soil under short-day conditions. The expression of actin (At2g37620) was included in all calculations as an internal normalization standard across samples, and expression relative to actin calculated as 2∧(ΔCT). Data represent means of 3 plants from each genotype, with 3 replicate real-time RT-PCR reactions per plant. Error bars represent the range around the mean calculated as 2∧(ΔCT±SD(ΔCT)) where SD(ΔCT) is calculated from composite SD of actin and At2g28670. B. Expression pattern of At2g28670 in root tissue of wild-type Col-0. Data derived from the Arabidopsis Gene Expression Database (http://arexdb.org/index.jsp) ,.
Figure 5
Figure 5. Principal component analysis of the shoot ionome of five week old wild-type Col-0, esb1-1 and esb1-2.
PCA based on the shoot concentrations of Li, B, Na, P, K, Ca, Mn, Fe, Co, Ni, Cu, Zn, As, Se, Mo and Cd in wild-type Col-0 (open circles), esb1-1 (grey diamonds) and esb1-2 (solid squares). The analysis was performed on data from n = 33 plants from each genotype. The raw data can be viewed and obtained from www.ionomicshub.org in trays 1095 and 1146.
Figure 6
Figure 6. Total root suberin and lignin in five week old wild-type Col-0, esb1-1 and esb1-2.
A. Aliphatic components of suberin were visualized by ultraviolet illumination using a fluorescence microscope after staining root tissue with Fluorol Yellow. B. Bright field image of the same roots shown in (A). C. Total content of the aliphatic components of suberin in roots of five week old wild type and mutant plants. Data represents mean values in µg per mg dry weight±standard deviations of wild type (Col-0) (n = 7), esb1-1 (n = 11) and esb1-2 (n = 3). Each sample containing 4–5 roots for each genotype. D. Total root lignin content of five week old wild type and mutant plants. Data represents mean values in µg per mg dry weight±standard deviations of wild type (Col-0), esb1-1 and esb1-2 with n = 4 biological replicates for each genotype, with each sample containing 4–5 roots for each genotype. * indicates data that is significantly different from wild-type Col-0 (t-test P<0.01).
Figure 7
Figure 7. Suberin aliphatic monomer composition in roots of five week old wild-type and mutant plants.
Suberin aliphatic monomers were analyzed using gas chromatography after release by transesterification using boron trifluoride in methanol from polysaccharide hydrolase digested and solvent extracted root cell walls. Absolute amounts of suberin monomers are shown as mean values in µg per mg dry weight±standard deviations of wild type (Col-0) (white bar; n = 7), esb1-1 (light grey bar; n = 11) and esb1-2 (dark grey bar; n = 3). Each sample containing 4–5 roots for each genotype.
Figure 8
Figure 8. Principal component analysis of the shoot ionome of five week old wild-type Col-0 and esb1 grafted plants.
PCA based on the shoot concentrations of Li, B, Na, P, K, Ca, Mn, Fe, Co, Ni, Cu, Zn, As, Se, Mo and Cd. A. Wild-type Col-0 self grafted (open circles), esb1-1 self grafted (grey diamonds), wild-type Col-0 shoot/esb1-1 root grafted (grey triangles) and esb1-1 shoot/wild-type Col-0 root grafted (solid squares). B. Wild-type Col-0 self grafted (open circles), esb1-2 self graft (grey diamonds), wild-type Col-0 shoot/esb1-2 root grafted (grey triangles) and esb1-2 shoot/wild-type Col-0 root grafted (solid squares). The analysis was performed on data from n = 11–27 plants from each grafting type.
Figure 9
Figure 9. Transpiration rates of five week old wild-type and mutant plants.
Five week old plants of Col-0, esb1-1 and esb1-2 grown under 12 hr/12 hr day/night were used for the transpiration experiment. Water loss from each plant was measured as weight change at 5 minute intervals over 62 hr. At the end of the experiment leaf area was measured and transpiration rate calculated. Data represents the mean±standard error of n = 6–7 replicate plants for each genotype. White diamonds = wild-type Col-0, grey squares = esb1-1 and white triangles = esb1-2. Black horizontal bars represent nighttime period, white bars represent daytime period.
Figure 10
Figure 10. Stomatal index and stomatal aperture of five week old wild-type Col-0 and mutant plants.
A. Stomatal index was calculated as the number of stomata as a percentage of the total cell number (epidermal cells+stomata) in a given leaf area. Measurement was performed on five week old plants grown with a 12 hr day length. Images were captured by scanning electron microscopy. Data represents the mean±standard error of the stomatal index calculated from the number of stomata and epidermal cells counted in a 0.18 mm2 area of 1–3 leaves from 2–4 independent plants for each genotype. On average 35 stomata and 130 epidermal cells were counted for each 0.18 mm2 area recorded. B. Stomatal aperture was measured using epidermal cell imprints on five week old plants. Data represents the mean±standard error of stomatal apertures measured from 1–2 leaves sampled from 8–11 independent plants for each genotype. Total stomatal apertures measured for wild-type Col-0 = 196, esb1-1 = 136 and esb1-2 = 203. * indicates data that is significantly different from wild-type Col-0 (t-test P<0.01).
Figure 11
Figure 11. Wilting resistance of grafted wild-type Col-0 and mutant plants.
After grafting plants were grown for 3 weeks in soil with regular watering, after which time watering was stopped and the plants' wilting status recorded at 11 days after water withdrawal. A. Wild-type Col-0 without water withdrawal as a control. B. Self grafted wild-type Col-0. C. Self grafted esb1-1. D. Self grafted esb1-2. E. esb1-1 shoot/wild-type Col-0 root grafted. F. Wild-type Col-0 shoot/esb1-1 root grafted. G. esb1-2 shoot/wild-type Col-0 root grafted. H. Wild-type Col-0 shoot/esb1-2 root grafted.
Figure 12
Figure 12. Water use efficiency of wild-type Col-0 and mutant plants.
Water use efficiency is the amount of water loss calculated per unit dry weight of plants. The amount of water used by each plant was measured over a five week period (34 days) using plants grown under 12 hr/12 hr day/night. At the end of five weeks shoot dry weight was measured. Data represents the mean±standard error of n = 30–35 independent plants for each genotype. * indicates data that is significantly different from wild-type Col-0 (t-test P<0.01). Insert. Example of plants with the three different genotypes after 34 days' growth at the end of the experiment.

References

    1. Hose E, Clarkson DT, Steudle E, Schreiber L, Hartung W. The exodermis: a variable apoplastic barrier. J Exp Bot. 2001;52:2245–2264. - PubMed
    1. Enstone DE, Peterson CA, Ma FS. Root endodermis and exodermis: Structure, function, and responses to the environment. J Plant Growth Regul. 2002;21:335–351.
    1. Zimmermann HM, Hartmann K, Schreiber L, Steudle E. Chemical composition of apoplastic transport barriers in relation to radial hydraulic conductivity of corn roots (Zea mays L.). Planta. 2000;210:302–311. - PubMed
    1. Freundl E, Steudle E, Hartung W. Apoplastic transport of abscisic acid through roots of maize: effect of the exodermis. Planta. 2000;210:222–231. - PubMed
    1. Harrison-Murray RS, Clarkson DT. Relationships between structural development and absorption of ions by root system of Cucurbita-Pepo. Planta. 1973;114:1–16. - PubMed

Publication types