. 2009 May 22;4(5):e5662.
doi: 10.1371/journal.pone.0005662.

Accumulating progenitor cells in the luminal epithelial cell layer are candidate tumor initiating cells in a Pten knockout mouse prostate cancer model

Affiliations

Accumulating progenitor cells in the luminal epithelial cell layer are candidate tumor initiating cells in a Pten knockout mouse prostate cancer model

Hanneke Korsten et al. PLoS One. .

Abstract

The PSA-Cre;Pten-loxP/loxP mouse prostate cancer model displays clearly defined stages of hyperplasia and cancer. Here, the initial stages of hyperplasia development are studied. Immunohistochemical staining showed that accumulated pAkt+ hyperplastic cells overexpress luminal epithelial cell marker CK8, and progenitor cell markers CK19 and Sca-1, but not basal epithelial cell markers. By expression profiling we identified novel hyperplastic cell markers, including Tacstd2 and Clu. Further we showed that at young age prostates of targeted Pten knockout mice contained in the luminal epithelial cell layer single pAkt+ cells, which overexpressed CK8, Sca-1, Tacstd2 and Clu; basal epithelial cells were always pAkt(-). Importantly, in the luminal epithelial cell layer of normal prostates we detected rare Clu+Tacstd2+Sca-1+ progenitor cells. These novel cells are candidate tumor initiating cells in Pten knockout mice. Remarkably, all luminal epithelial cells in the proximal region of normal prostates were Clu+Tacstd2+Sca-1+. However, in PSA-Cre;Pten-loxP/loxP mice, the proximal prostate does not contain hyperplastic foci. Small hyperplastic foci in prostates of PSA-Cre;Pten-loxP/+ mice found at old age, showed complete Pten inactivation and a progenitor marker profile. Finally, we present a novel model of prostate development and renewal, including lineage-specific luminal epithelial progenitor cells. It is proposed that Pten deficiency induces a shift in the balance of differentiation to proliferation in these cells.


Conflict of interest statement

Competing Interests: The authors have declared that no competing interests exist.

Figures

Figure 1
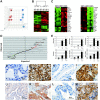
Figure 1. Identification of new hyperplastic cell markers in prostates of PSA-Cre;Pten-loxP/loxP mice.
(A) Principal component analysis (PCA) of gene expression in normal prostates (blue circles) and hyperplastic prostates of PSA-Cre;Pten-loxP/loxP mice (red circles) at 4–5m. (B) Unsupervised hierarchical clustering of the gene expression profiles of five normal prostates (NP) and five hyperplastic prostates (HP). Green indicates lower gene expression and red indicates higher expression. (C) The twenty genes with the largest differential expression in HP as compared to NP as determined by calculation of the difference in mean expression level. (D) Significance Analysis of Microarrays (SAM) of the same samples as shown in C. Note that by SAM analysis essentially identical genes were identified as by calculation of the difference in mean expression level. (E) QPCR analysis of the five genes with the highest expression in HP as compared to NP and of Sca-1. Each subgroup was composed of five prostate samples. The expression levels in hyperplastic prostates of 2m and 4–5m old mice and in prostates of control littermates are shown as average expression level +/− SE relative to Hprt expression. (F–M) Immunohistochemical analysis of new hyperplastic cell markers in NP and HP of PSA-Cre;Pten-loxP/loxP mice (4–5m). (F) Tacstd2 NP, (G) Tacstd2 HP, (H) Clu NP, (I) Clu HP, (J) Ppp1r1b NP, (K) Ppp1r1b HP, (L) Sca-1 NP and (M) Sca-1 HP.
Figure 2
Figure 2. Single pAkt+ luminal epithelial cells in prostates of young PSA-Cre;Pten-loxP/loxP mice (4–5w) are Clu+Tacstd2+Sca-1+.
(A) Prostate weights (average +/− SE) of wild type mice and PSA-Cre;Pten-loxP/loxP mice at 4–5w, 2m and 4–5m. (B) pAkt staining of hyperplastic foci/cells in the luminal epithelial cell layer of a prostate of a 4–5w old PSA-Cre;Pten-loxP/loxP mouse. Magnifications of three indicated regions are shown in B1, B2 and B3. Arrow heads in B1 and B2 indicate single pAkt+ cells. Phospho-Akt staining of prostates of 2m (C) and 4–5m (D) old PSA-Cre;Pten-loxP/loxP mice shows that respectively ∼70% and 100% of the luminal epithelial cells were pAkt+. (E) Consecutive slides of a prostate of a 4–5w old PSA-Cre;Pten-loxP/loxP mouse stained for Clu, Tacstd2 and Sca-1 shows coexpression of these markers in a small hyperplastic focus. Immunofluorescent double stainings confirmed co-localization of (F) Tacstd2 and pAkt, (G) Clu and pAkt and (I) CK8 and pAkt. (H) pAkt+ cells were not observed in the p63+ basal epithelial cell layer.
Figure 3
Figure 3. Hyperplastic cells in prostates of PSA-Cre;Pten-loxP/+ mice and PSA-Cre;Pten-loxP/loxP mice express identical markers.
Consecutive sections of a hyperplastic focus in the prostate of a PSA-Cre;Pten-loxP/+ mouse were stained for (B) pAkt and the hyperplastic cell markers (A) Clu, (C) Tacstd2 and (D) Sca-1 by immunohistochemistry.
Figure 4
Figure 4. Single Clu+Tacstd2+Sca-1+ cells are present in the luminal epithelial cell layer of the normal prostate.
(A) Clu staining of a normal prostate of a 4–5w old mouse. Scattered throughout the prostate lobe, single Clu+ cells in the luminal epithelial cell layer were observed. An overview of a whole prostate lobe and higher magnifications of three indicated regions are shown. Arrows indicate positive cells. (B) Tacstd2+ and (C) Sca-1+ cells in the luminal epithelial cell layer of the developing prostate (4–5w). (D) Clu staining of an adult normal prostate (4–5m) showed rare Clu+ cells in the luminal epithelial cell layer. (D1) Higher magnification of the indicated region in (D). (E–J) Immunofluorescent double staining of Clu+ and Tacstd2+ cells in the luminal epithelial cell layer of the normal prostate. In normal prostates Clu+ and Tacstd2+ cells were negative for pAkt (E,F), overexpressed CK8 (G,H) and did not express p63 (I,J).
Figure 5
Figure 5. All luminal epithelial cells in the proximal prostate express luminal epithelial progenitor cell markers.
(A) Schematic picture of a mouse prostate lobe indicating the urethra, the proximal and the distal prostate region. (B) Heamatoxylin eosin staining of a longitudinal positioned mouse prostate lobe. Magnifications of the distal (B1) and the proximal (B2) prostate, as indicated in B, showed a difference in morphology of the luminal epithelial cells in the proximal and the distal prostate. (C–E) Immunohistochemical analysis of luminal epithelial cells in the proximal region of a normal mouse prostate. (C) p63; (D) CK8 and (E) Sca-1 staining. Dashed lines indicate the abrupt transition of epithelium of the proximal to the distal prostate.
Figure 6
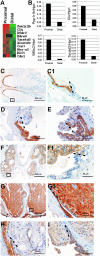
Figure 6. Hyperplastic prostates of PSA-Cre;Pten-loxP/loxP mice and luminal epithelial cells in the proximal prostate overexpress identical genes.
(A) Expression profiling of the proximal and distal prostate region of a normal mouse prostate (4–5m) shows that genes high expressed in hyperplastic prostates of PSA-Cre;Pten-loxP/loxP mice are among the ten genes with the highest expression in two proximal prostates as compared to two distal prostates. (B) QPCR analysis of hyperplasia markers with high expression in the proximal prostate. (C–E) Immunohistochemical analysis confirms high expression of hyperplastic cell markers in the luminal epithelial cell layer of the proximal region of the normal prostate. (C) Clu staining of a normal prostate lobe, (C1) magnification of the transition of the proximal to the distal region as indicated in C. Staining for (D) Ppp1r1b and (E) Tacstd2. Hyperplasia development did not occur in the proximal prostate of PSA-Cre;Pten-loxP/loxP mice (4–5m). Proximal luminal epithelial cells of the hyperplastic prostates were negative for pAkt (F, magnification of transition proximal/distal prostate in F1), although these cells overexpressed (G, G1) Clu, (H) Ppp1r1b and (I) Tacstd2.
Figure 7
Figure 7. Model for hyperplasia development in PSA-Cre;Pten-loxP/loxP mice.
The model shows novel identified lineage-specific luminal epithelial progenitor cells in the luminal epithelial cell layer as candidate tumor initiating cells in the prostate cancer mouse model, as indicated by a red background.

References

    1. Jemal A, Siegel R, Ward E, Hao Y, Xu J, et al. Cancer statistics, 2008. CA Cancer J Clin. 2008;58:71–96. - PubMed
    1. Majumder PK, Sellers WR. Akt-regulated pathways in prostate cancer. Oncogene. 2005;24:7465–7474. - PubMed
    1. Salmena L, Carracedo A, Pandolfi PP. Tenets of PTEN tumor suppression. Cell. 2008;133:403–414. - PubMed
    1. Leslie NR, Downes CP. PTEN function: how normal cells control it and tumour cells lose it. Biochem J. 2004;382:1–11. - PMC - PubMed
    1. Hamada K, Sasaki T, Koni PA, Natsui M, Kishimoto H, et al. The PTEN/PI3K pathway governs normal vascular development and tumor angiogenesis. Genes Dev. 2005;19:2054–2065. - PMC - PubMed

Publication types

MeSH terms