

Relationship between phylogenetic distribution and genomic features in Neurospora crassa
- PMID: 19461939
- PMCID: PMC2684829
- DOI: 10.1371/journal.pone.0005286
Relationship between phylogenetic distribution and genomic features in Neurospora crassa
Abstract
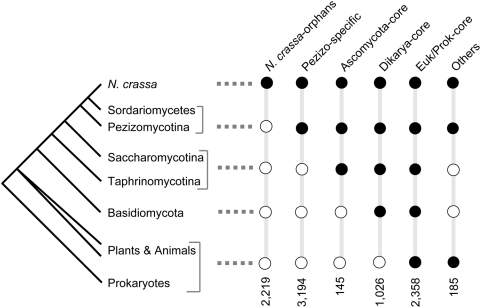
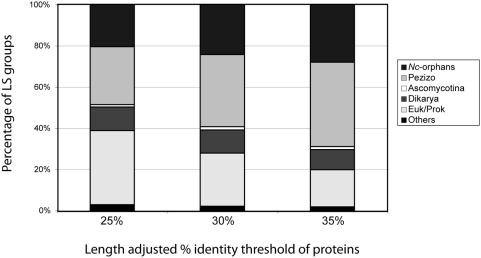
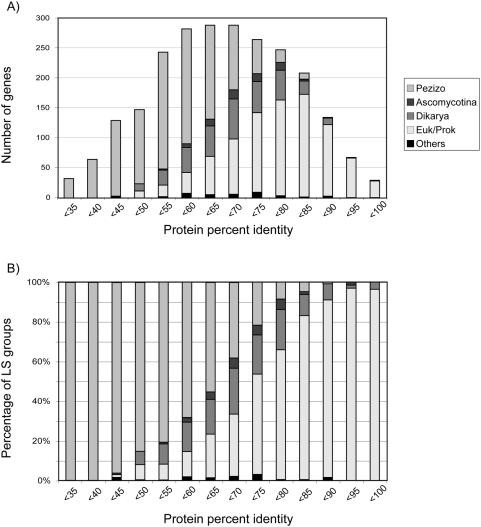
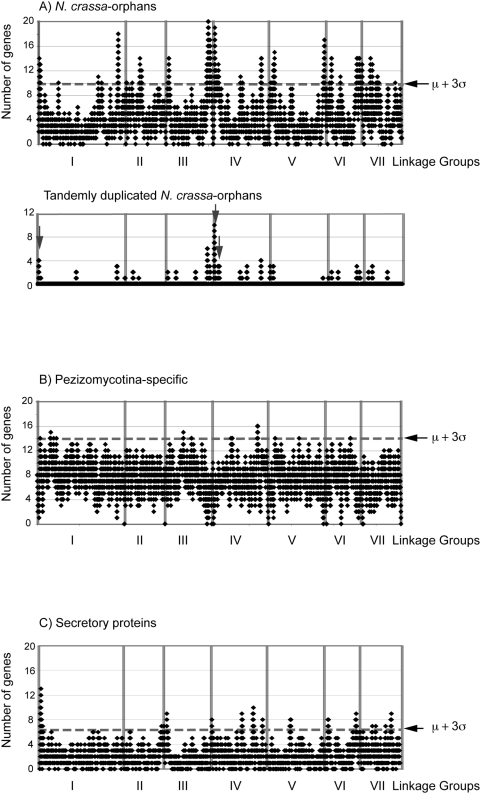
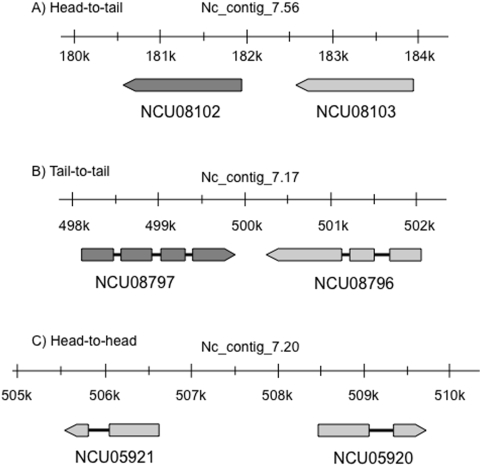
In the post-genome era, insufficient functional annotation of predicted genes greatly restricts the potential of mining genome data. We demonstrate that an evolutionary approach, which is independent of functional annotation, has great potential as a tool for genome analysis. We chose the genome of a model filamentous fungus Neurospora crassa as an example. Phylogenetic distribution of each predicted protein coding gene (PCG) in the N. crassa genome was used to classify genes into six mutually exclusive lineage specificity (LS) groups, i.e. Eukaryote/Prokaryote-core, Dikarya-core, Ascomycota-core, Pezizomycotina-specific, N. crassa-orphans and Others. Functional category analysis revealed that only approximately 23% of PCGs in the two most highly lineage-specific grouping, Pezizomycotina-specific and N. crassa-orphans, have functional annotation. In contrast, approximately 76% of PCGs in the remaining four LS groups have functional annotation. Analysis of chromosomal localization of N. crassa-orphan PCGs and genes encoding for secreted proteins showed enrichment in subtelomeric regions. The origin of N. crassa-orphans is not known. We found that 11% of N. crassa-orphans have paralogous N. crassa-orphan genes. Of the paralogous N. crassa-orphan gene pairs, 33% were tandemly located in the genome, implying a duplication origin of N. crassa-orphan PCGs in the past. LS grouping is thus a useful tool to explore and understand genome organization, evolution and gene function in fungi.
Conflict of interest statement
Figures
Similar articles
-
What's in the genome of a filamentous fungus? Analysis of the Neurospora genome sequence.Nucleic Acids Res. 2003 Apr 1;31(7):1944-54. doi: 10.1093/nar/gkg293. Nucleic Acids Res. 2003. PMID: 12655011 Free PMC article.
-
Evolution and diversity of a fungal self/nonself recognition locus.PLoS One. 2010 Nov 19;5(11):e14055. doi: 10.1371/journal.pone.0014055. PLoS One. 2010. PMID: 21124910 Free PMC article.
-
Large-scale comparison of fungal sequence information: mechanisms of innovation in Neurospora crassa and gene loss in Saccharomyces cerevisiae.Genome Res. 2000 Apr;10(4):416-30. doi: 10.1101/gr.10.4.416. Genome Res. 2000. PMID: 10779483
-
Large scale analysis of sequences from Neurospora crassa.J Biotechnol. 2002 Mar 14;94(1):3-13. doi: 10.1016/s0168-1656(01)00415-1. J Biotechnol. 2002. PMID: 11792448 Review.
-
The Neurospora crassa genome opens up the world of filamentous fungi.Genome Biol. 2003;4(6):217. doi: 10.1186/gb-2003-4-6-217. Epub 2003 May 28. Genome Biol. 2003. PMID: 12801405 Free PMC article. Review.
Cited by
-
Lineage-specific genes are clustered with HET-domain genes and respond to environmental and genetic manipulations regulating reproduction in Neurospora.PLoS Genet. 2023 Nov 7;19(11):e1011019. doi: 10.1371/journal.pgen.1011019. eCollection 2023 Nov. PLoS Genet. 2023. PMID: 37934795 Free PMC article.
-
Analyses of expressed sequence tags in Neurospora reveal rapid evolution of genes associated with the early stages of sexual reproduction in fungi.BMC Evol Biol. 2012 Nov 27;12:229. doi: 10.1186/1471-2148-12-229. BMC Evol Biol. 2012. PMID: 23186325 Free PMC article.
-
Causes and consequences of genome expansion in fungi.Genome Biol Evol. 2012;4(1):13-23. doi: 10.1093/gbe/evr124. Epub 2011 Nov 24. Genome Biol Evol. 2012. PMID: 22117086 Free PMC article.
-
The HaloTag: Improving Soluble Expression and Applications in Protein Functional Analysis.Curr Chem Genomics. 2012;6:8-17. doi: 10.2174/1875397301206010008. Epub 2012 Sep 20. Curr Chem Genomics. 2012. PMID: 23115610 Free PMC article.
-
De novo assembly of a 40 Mb eukaryotic genome from short sequence reads: Sordaria macrospora, a model organism for fungal morphogenesis.PLoS Genet. 2010 Apr 8;6(4):e1000891. doi: 10.1371/journal.pgen.1000891. PLoS Genet. 2010. PMID: 20386741 Free PMC article.
References
-
- Galagan JE, Calvo SE, Borkovich KA, Selker EU, Read ND, et al. The genome sequence of the filamentous fungus Neurospora crassa. Nature. 2003;422:859–868. - PubMed
-
- Cai JJ, Woo PCY, Lau SKP, Smith DK, Yuen KY. Accelerated evolutionary rate may be responsible for the emergence of lineage-specific genes in Ascomycota. J Mol Evol. 2006;63:1–11. - PubMed
-
- Arnold R, Rattei T, Tischler P, Truong MD, Stumpflen V, et al. SIMAP - The similarity matrix of proteins. Bioinformatics. 2005;21:42–46. - PubMed
Publication types
MeSH terms
Substances
Grants and funding
LinkOut - more resources
Full Text Sources
Miscellaneous
