

A method to generate human mesenchymal stem cell-derived neurons which express and are excited by multiple neurotransmitters
- PMID: 19461957
- PMCID: PMC2683550
- DOI: 10.1251/bpo147
A method to generate human mesenchymal stem cell-derived neurons which express and are excited by multiple neurotransmitters
Abstract
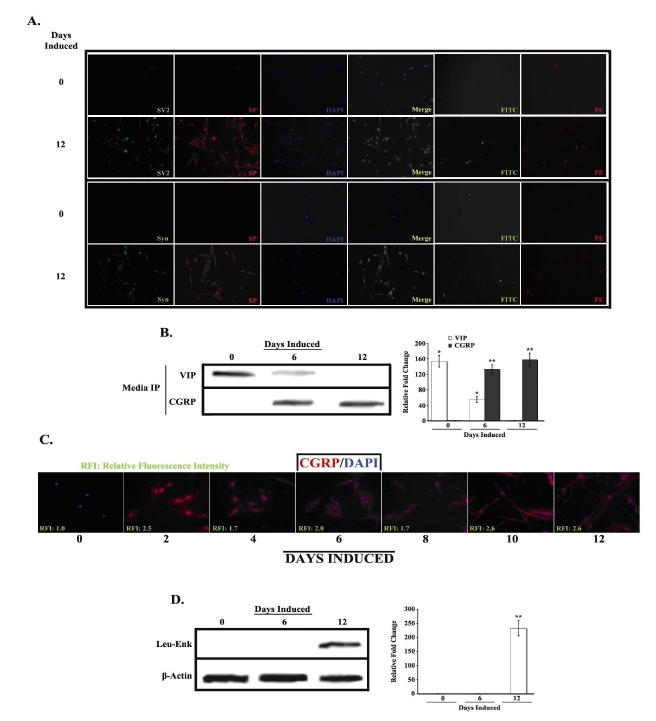
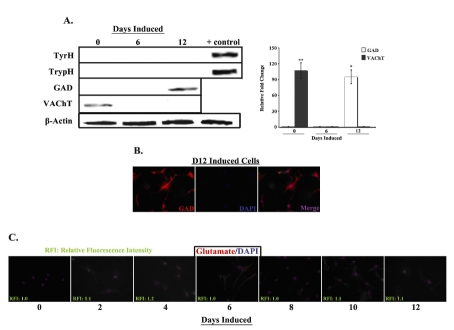
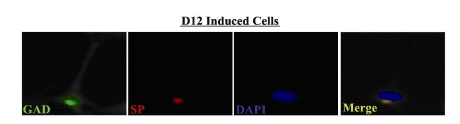
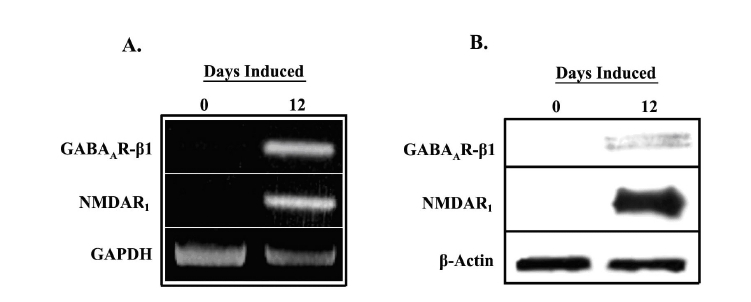
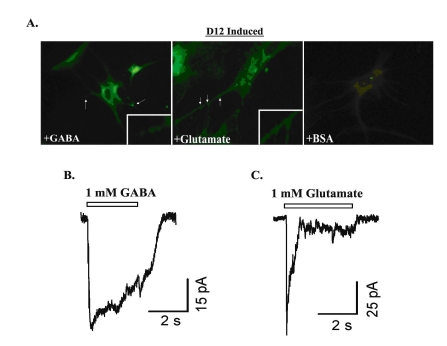
The present study describes a protocol to generate heterogenous populations of neurotransmitter-producing neurons from human mesenchymal stem cells (MSCs). MSCs are bone marrow (BM)-derived cells which undergo lineage- specific differentiation to generate bone, fat, cartilage and muscle, but are also capable of transdifferentiating into defined ectodermal and endodermal tissues. The purpose of this study is to evaluate the potential of MSCs as an alternative source of customized neurons for experimental neurobiology or other regenerative approaches. Our neuronal protocol utilizes freshly harvested human MSCs cultured on specific surfaces and exposed to an induction cocktail consisting of low serum concentration, retinoic acid (RA), growth factors and supplements. Here we report on the types of neurotransmitters produced by the neurons, and demonstrate that the cells are electrically responsive to exogenous neurotransmitter administration.
Keywords: Gamma-aminobutyric acid; Mesenchymal stem cells.
Figures
Similar articles
-
An interdisciplinary approach and characterization of neuronal cells transdifferentiated from human mesenchymal stem cells.Stem Cells Dev. 2007 Oct;16(5):811-26. doi: 10.1089/scd.2007.0011. Stem Cells Dev. 2007. PMID: 17999602
-
Isolation and characterization of neurogenic mesenchymal stem cells in human scalp tissue.Stem Cells. 2005 Aug;23(7):1012-20. doi: 10.1634/stemcells.2004-0125. Epub 2005 Jun 7. Stem Cells. 2005. PMID: 15941858
-
Directed Differentiation of Human-Induced Pluripotent Stem Cells to Mesenchymal Stem Cells.Methods Mol Biol. 2016;1416:289-98. doi: 10.1007/978-1-4939-3584-0_17. Methods Mol Biol. 2016. PMID: 27236679
-
Bone marrow mesenchymal cells: how do they contribute to tissue repair and are they really stem cells?Arch Immunol Ther Exp (Warsz). 2011 Oct;59(5):369-78. doi: 10.1007/s00005-011-0139-9. Epub 2011 Jul 26. Arch Immunol Ther Exp (Warsz). 2011. PMID: 21789625 Review.
-
Muse Cells Provide the Pluripotency of Mesenchymal Stem Cells: Direct Contribution of Muse Cells to Tissue Regeneration.Cell Transplant. 2016;25(5):849-61. doi: 10.3727/096368916X690881. Epub 2016 Feb 15. Cell Transplant. 2016. PMID: 26884346 Review.
Cited by
-
Motor Recovery after Transplantation of Bone Marrow Mesenchymal Stem Cells in Rat Models of Spinal Cord Injury.Ann Neurosci. 2019 Jan;25(3):126-140. doi: 10.1159/000487069. Epub 2018 Apr 25. Ann Neurosci. 2019. PMID: 30814821 Free PMC article.
-
Developmental regulation of TAC1 in peptidergic-induced human mesenchymal stem cells: implication for spinal cord injury in zebrafish.Stem Cells Dev. 2012 Jan 20;21(2):308-20. doi: 10.1089/scd.2011.0179. Epub 2011 Jul 26. Stem Cells Dev. 2012. PMID: 21671725 Free PMC article.
-
Application of Mesenchymal Stem Cells in Targeted Delivery to the Brain: Potential and Challenges of the Extracellular Vesicle-Based Approach for Brain Tumor Treatment.Int J Mol Sci. 2021 Oct 17;22(20):11187. doi: 10.3390/ijms222011187. Int J Mol Sci. 2021. PMID: 34681842 Free PMC article. Review.
-
Expression pattern of neurotrophins and their receptors during neuronal differentiation of adipose-derived stem cells in simulated microgravity condition.Iran J Basic Med Sci. 2017 Feb;20(2):178-186. doi: 10.22038/ijbms.2017.8244. Iran J Basic Med Sci. 2017. PMID: 28293395 Free PMC article.
-
Cell Signaling and Differential Protein Expression in Neuronal Differentiation of Bone Marrow Mesenchymal Stem Cells with Hypermethylated Salvador/Warts/Hippo (SWH) Pathway Genes.PLoS One. 2015 Dec 29;10(12):e0145542. doi: 10.1371/journal.pone.0145542. eCollection 2015. PLoS One. 2015. PMID: 26713735 Free PMC article.
References
-
- Korecka JA, Verhaagen J, Hol EM. Cell-replacement and gene-therapy strategies for Parkinson's and Alzheimer's disease. Regen Med. 2007;2:425–446. - PubMed
-
- Silani V, Corbo M. Cell-replacement therapy with stem cells in neurodegenerative diseases. Curr Neurovasc Res. 2004;1:283–289. - PubMed
-
- Kocher AA, Schlechta B, Gasparovicova A, Wolner E, Bonaros N, Laufer G. Stem cells and cardiac regeneration. Transpl Int. 2007;20:731–746. - PubMed
-
- Lock LT, Tzanakakis ES. Stem/Progenitor cell sources of insulin-producing cells for the treatment of diabetes. Tissue Eng. 2007;13:1399–1412. - PubMed
LinkOut - more resources
Full Text Sources
