

"Fit-for-purpose" method validation and application of a biomarker (C-terminal telopeptides of type 1 collagen) in denosumab clinical studies
- PMID: 19462251
- PMCID: PMC2691475
- DOI: 10.1208/s12248-009-9115-2
"Fit-for-purpose" method validation and application of a biomarker (C-terminal telopeptides of type 1 collagen) in denosumab clinical studies
Abstract
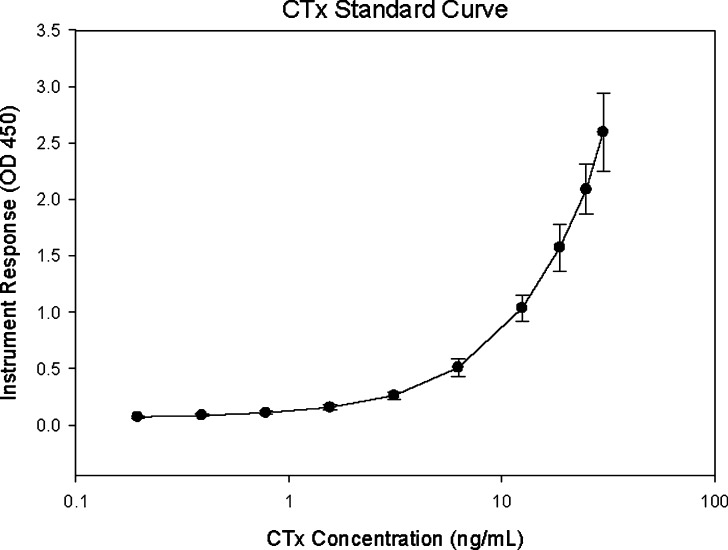
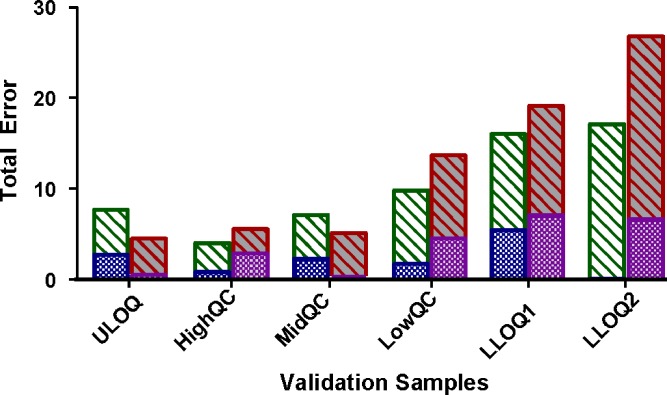
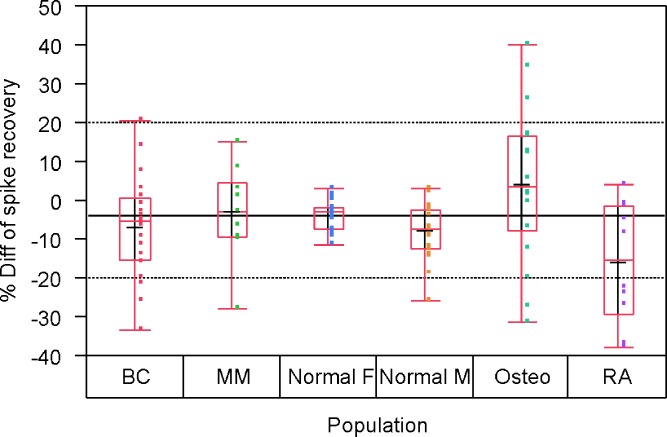
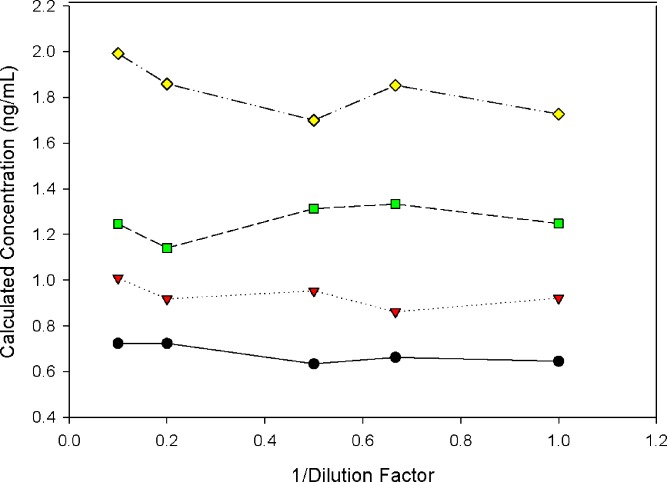
Biomarkers are used to study drug effects, exposure-response relationships, and facilitate early decision making during development. Denosumab, a fully human monoclonal antibody against receptor activator of nuclear factor-kappaB ligand, profoundly inhibits bone resorption. C-terminal telopeptides of type I collagen (CTx), a bone resorption biomarker, provides early indications of denosumab effectiveness and informs protracted clinical outcomes (e.g., bone mineral density). Because of the dynamic relationship between denosumab and CTx, a precise and robust assay was desired. Thus, we adopted a fit-for-purpose approach to modify and validate a commercial CTx diagnostic kit to meet the intended applications of a quantitative pharmacodynamic biomarker for denosumab development. Seven standards were prepared to replace five calibrators provided in the kit. Three quality controls (QC) and two sample controls were used to characterize and monitor assay performance. Robotic workstations were used for standard and QC preparation and assay execution. Method validation experiments were conducted with rigor and procedures similar to those used for drug bioanalysis. The method demonstrated a linear range of 0.0490-2.34 ng/mL with four-parameter logistic regression. Inter-assay total error of validation samples in serum was < or = 26.7%. Extensive tests were conducted on selectivity in sera from target populations, specificity, stability, parallelism, and dilutional linearity. Applications to samples from numerous clinical studies confirmed that the CTx method was reliable, robust, and fit for use as an early indicator of denosumab effectiveness. Refinement supported the confidence for use in pharmacokinetic/pharmacodynamic modeling, dose selections, correlation to clinical effects, and formulation bioequivalence work.
Figures
Similar articles
-
Effects of denosumab on bone turnover markers in postmenopausal osteoporosis.J Bone Miner Res. 2011 Mar;26(3):530-7. doi: 10.1002/jbmr.251. J Bone Miner Res. 2011. PMID: 20839290 Clinical Trial.
-
Integrated cellular bone homeostasis model for denosumab pharmacodynamics in multiple myeloma patients.J Pharmacol Exp Ther. 2008 Aug;326(2):555-62. doi: 10.1124/jpet.108.137703. Epub 2008 May 6. J Pharmacol Exp Ther. 2008. PMID: 18460643 Free PMC article. Clinical Trial.
-
Denosumab, a fully human monoclonal antibody to RANKL, inhibits bone resorption and increases BMD in knock-in mice that express chimeric (murine/human) RANKL.J Bone Miner Res. 2009 Feb;24(2):182-95. doi: 10.1359/jbmr.081112. J Bone Miner Res. 2009. PMID: 19016581
-
Emerging treatments for postmenopausal osteoporosis - focus on denosumab.Clin Interv Aging. 2009;4:241-50. doi: 10.2147/cia.s3333. Epub 2009 Jun 9. Clin Interv Aging. 2009. PMID: 19554095 Free PMC article. Review.
-
Denosumab--an emerging treatment for postmenopausal osteoporosis.Expert Opin Biol Ther. 2010 Mar;10(3):467-76. doi: 10.1517/14712591003604708. Expert Opin Biol Ther. 2010. PMID: 20095877 Review.
Cited by
-
Validation of a ligand binding assay using dried blood spot sampling.AAPS J. 2013 Jan;15(1):123-31. doi: 10.1208/s12248-012-9430-x. Epub 2012 Nov 8. AAPS J. 2013. PMID: 23135927 Free PMC article.
-
Calculations for Adjusting Endogenous Biomarker Levels During Analytical Recovery Assessments for Ligand-Binding Assay Bioanalytical Method Validation.AAPS J. 2015 Jul;17(4):939-47. doi: 10.1208/s12248-015-9756-2. Epub 2015 Apr 23. AAPS J. 2015. PMID: 25903932 Free PMC article.
-
Recommendations for Selection and Characterization of Protein Biomarker Assay Calibrator Material.AAPS J. 2017 Nov;19(6):1550-1563. doi: 10.1208/s12248-017-0146-9. Epub 2017 Oct 2. AAPS J. 2017. PMID: 28971363
-
Quantitative hydrophilic interaction chromatography-mass spectrometry analysis of N-acetylneuraminic acid and N-acetylmannosamine in human plasma.J Chromatogr B Analyt Technol Biomed Life Sci. 2015 Sep 1;1000:105-11. doi: 10.1016/j.jchromb.2015.07.018. Epub 2015 Jul 17. J Chromatogr B Analyt Technol Biomed Life Sci. 2015. PMID: 26218770 Free PMC article.
-
Quantitation of cytidine-5'-monophospho-N-acetylneuraminic acid in human leukocytes using LC-MS/MS: method development and validation.Biomed Chromatogr. 2020 Feb;34(2):e4735. doi: 10.1002/bmc.4735. Epub 2020 Jan 8. Biomed Chromatogr. 2020. PMID: 31691999 Free PMC article.
References
MeSH terms
Substances
LinkOut - more resources
Full Text Sources
