. 2009 Oct;91(10):830-40.
doi: 10.1002/bip.21262.

Mechanistic basis for differential inhibition of the F1Fo-ATPase by aurovertin

Affiliations

Mechanistic basis for differential inhibition of the F1Fo-ATPase by aurovertin

Kathryn M Johnson et al. Biopolymers. 2009 Oct.

Abstract

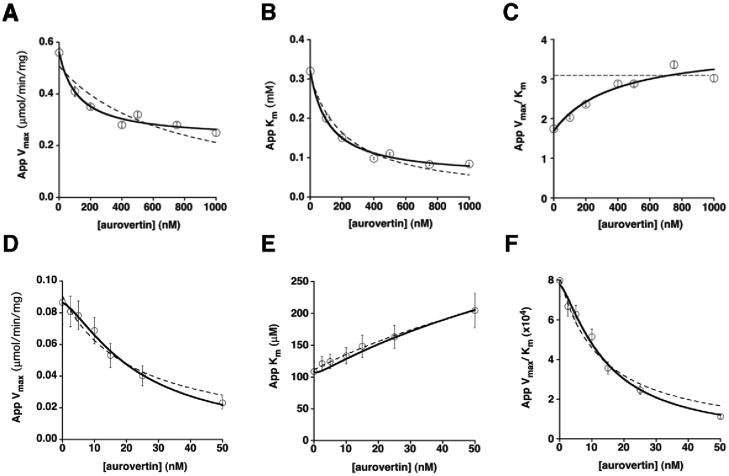
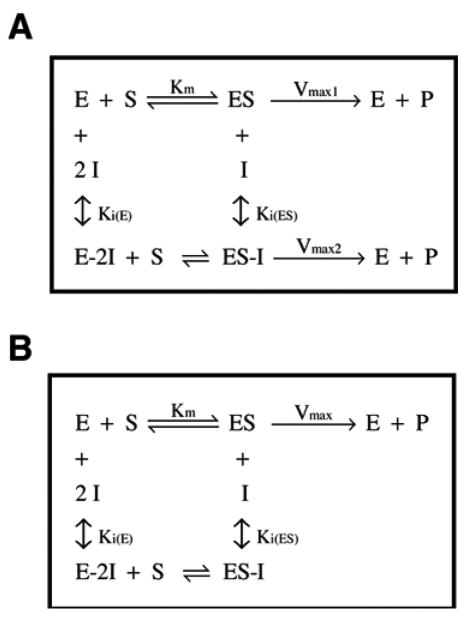
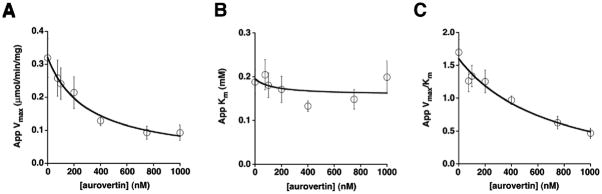
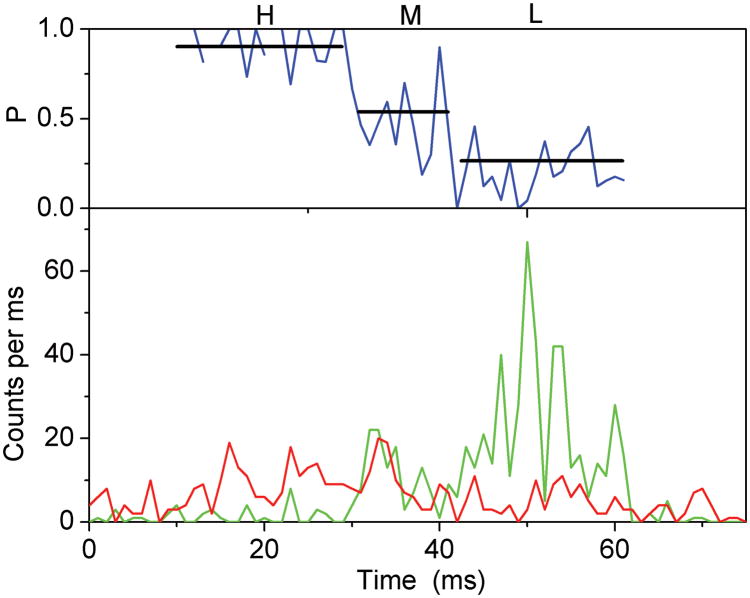
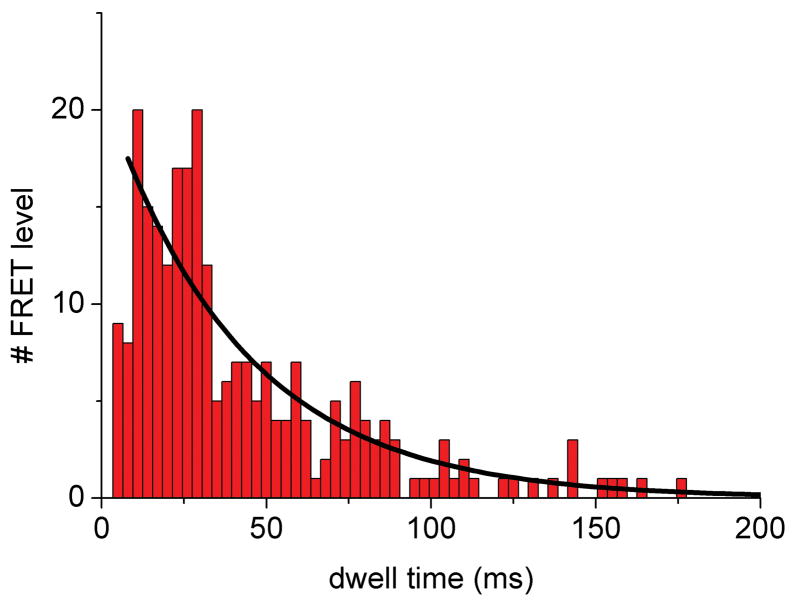
The mitochondrial F(1)F(o)-ATPase performs the terminal step of oxidative phosphorylation. Small molecules that modulate this enzyme have been invaluable in helping decipher F(1)F(o)-ATPase structure, function, and mechanism. Aurovertin is an antibiotic that binds to the beta subunits in the F(1) domain and inhibits F(1)F(o)-ATPase-catalyzed ATP synthesis in preference to ATP hydrolysis. Despite extensive study and the existence of crystallographic data, the molecular basis of the differential inhibition and kinetic mechanism of inhibition of ATP synthesis by aurovertin has not been resolved. To address these questions, we conducted a series of experiments in both bovine heart mitochondria and E. coli membrane F(1)F(o)-ATPase. Aurovertin is a mixed, noncompetitive inhibitor of both ATP hydrolysis and synthesis with lower K(i) values for synthesis. At low substrate concentrations, inhibition is cooperative suggesting a stoichiometry of two aurovertin per F(1)F(o)-ATPase. Furthermore, aurovertin does not completely inhibit the ATP hydrolytic activity at saturating concentrations. Single-molecule experiments provide evidence that the residual rate of ATP hydrolysis seen in the presence of saturating concentrations of aurovertin results from a decrease in the binding change mechanism by hindering catalytic site interactions. The results from these studies should further the understanding of how the F(1)F(o)-ATPase catalyzes ATP synthesis and hydrolysis.


Figures

Figure 1
Figure 1
Aurovertin inhibition of the F1Fo-ATPase in bovine SMPs. ATP hydrolysis: Aurovertin decreases both the apparent Vmax (A) and Km (B), and increases the apparent Vmax/Km (C). The plots of the kinetic parameters in panels A, B, and C were fit using either eq 1 for a purely uncompetitive inhibitor (dotted lines) or eq 2–4 for a mixed inhibitor with residual activity of the enzyme-substrate-inhibitor (ESI) complex (solid lines), as described in Materials and Methods. Fits shown are with all n values set equal to 1. ATP synthesis: Aurovertin decreases both the apparent Vmax (D) and Vmax/Km (F), and increases the apparent Km (E). The Vmax and Vmax/Km plots were fit using eq 1 and the plot of Km was fit using eq 3, consistent with mixed inhibition. The fits are shown with n(E) and n(ES) both set equal to 1 (dotted lines), and with n(E) = 2, n(ES) = 1 (solid lines).
Figure 2
Figure 2
Proposed models for inhibition of the bovine F1Fo-ATPase by aurovertin. (A) ATP hydrolysis. (B) ATP synthesis.
Figure 3
Figure 3
Aurovertin inhibition of ATP hydrolysis in E. coli membranes. Aurovertin decreases the apparent Vmax (A) and Vmax/Km (C), while the apparent Km remains relatively constant (B). These data were fit using eq 2–4 for a mixed inhibitor with residual activity of ESI, as described in Materials and Methods.
Figure 4
Figure 4
Photon bursts and proximity factor distributions of single FRET-labeled F1Fo-ATPases from E. coli in liposomes in the presence of 1 mM ATP (A) and 1 mM ATP with 20 μM aurovertin (B). The F1Fo-ATPase was labeled with rhodamine 110 at the rotating γ subunit and with Cy5-bismaleimide crosslinking the static b2 subunits. Background-corrected fluorescence time trajectories of FRET donor (ID, green) and acceptor (IA, red) are shown in the lower panel and the corresponding proximity factor P=IA/(ID+IA) as blue trace in the upper panel. The sequential transitions of three proximity factor levels within the burst indicate stepwise rotation of γ. The intermediate FRET level (M) in the absence of aurovertin has a dwell time of 10 ms (A). The intermediate FRET level (L) in the presence of aurovertin has a dwell time of 15 ms (B). (C, D) Distribution of proximity factors of FRET-labeled F1Fo-ATPases upon ATP hydrolysis. (C) Distribution of FRET levels of rotating F1Fo-ATPase in the presence of 1 mM ATP showing three or more levels within single photon bursts (556 levels in total). (D) Distribution of FRET levels in the presence of ATP plus 20 μM aurovertin (617 levels in total). Thresholds of minimal FRET level dwells of 10 ms, minimal mean photon count rates of 5 counts per ms, maximal peak intensities of 150 counts per ms, and fluctuations of the proximity factor P of less than 0.15 in each FRET level were applied.
Figure 4
Figure 4
Photon bursts and proximity factor distributions of single FRET-labeled F1Fo-ATPases from E. coli in liposomes in the presence of 1 mM ATP (A) and 1 mM ATP with 20 μM aurovertin (B). The F1Fo-ATPase was labeled with rhodamine 110 at the rotating γ subunit and with Cy5-bismaleimide crosslinking the static b2 subunits. Background-corrected fluorescence time trajectories of FRET donor (ID, green) and acceptor (IA, red) are shown in the lower panel and the corresponding proximity factor P=IA/(ID+IA) as blue trace in the upper panel. The sequential transitions of three proximity factor levels within the burst indicate stepwise rotation of γ. The intermediate FRET level (M) in the absence of aurovertin has a dwell time of 10 ms (A). The intermediate FRET level (L) in the presence of aurovertin has a dwell time of 15 ms (B). (C, D) Distribution of proximity factors of FRET-labeled F1Fo-ATPases upon ATP hydrolysis. (C) Distribution of FRET levels of rotating F1Fo-ATPase in the presence of 1 mM ATP showing three or more levels within single photon bursts (556 levels in total). (D) Distribution of FRET levels in the presence of ATP plus 20 μM aurovertin (617 levels in total). Thresholds of minimal FRET level dwells of 10 ms, minimal mean photon count rates of 5 counts per ms, maximal peak intensities of 150 counts per ms, and fluctuations of the proximity factor P of less than 0.15 in each FRET level were applied.
Figure 5
Figure 5
Dwell time histograms of single FRET-labeled F1Fo-ATPase from E. coli in liposomes showing aurovertin inhibition of ATP hydrolysis. FRET levels were assigned manually and dwell times binned to 3 ms. (A) Dwell time histogram in the presence of 1 mM ATP; (B) dwell time histogram in the presence of 20 μM aurovertin and 1 mM ATP. Black lines are monoexponential decay fittings.
Figure 5
Figure 5
Dwell time histograms of single FRET-labeled F1Fo-ATPase from E. coli in liposomes showing aurovertin inhibition of ATP hydrolysis. FRET levels were assigned manually and dwell times binned to 3 ms. (A) Dwell time histogram in the presence of 1 mM ATP; (B) dwell time histogram in the presence of 20 μM aurovertin and 1 mM ATP. Black lines are monoexponential decay fittings.

Similar articles

Cited by

References

    1. Linnett PE, Beechey RB. Methods Enzymol. 1979;55:472–518. - PubMed
    1. Lardy HA, Connelly JL, Johnson D. Biochemistry. 1964;3:1961–1968. - PubMed
    1. Satre M, Klein G, Vignais PV. J Bacteriol. 1978;134:17–23. - PMC - PubMed
    1. Verschoor GJ, van der Sluis PR, Slater EC. Biochim Biophys Acta. 1977;462:438–449. - PubMed
    1. Douglas MG, Koh Y, Dockter ME, Schatz G. J Biol Chem. 1977;252:8333–8335. - PubMed

Publication types

MeSH terms