

Localizing the chemical forms of sulfur in vivo using X-ray fluorescence spectroscopic imaging: application to onion (Allium cepa) tissues
- PMID: 19463015
- PMCID: PMC10698848
- DOI: 10.1021/bi900368x
Localizing the chemical forms of sulfur in vivo using X-ray fluorescence spectroscopic imaging: application to onion (Allium cepa) tissues
Abstract
Sulfur has a particularly rich biochemistry and fills a number of important roles in biology. In situ information on sulfur biochemistry is generally difficult to obtain because of a lack of biophysical techniques that have sufficient sensitivity to molecular form. We have recently reported that sulfur K-edge X-ray absorption spectroscopy can be used as a direct probe of the sulfur biochemistry of living mammalian cells [Gnida, M., et al. (2007) Biochemistry 46, 14735-14741]. Here we report an extension of this work and develop sulfur K-edge X-ray fluorescence spectroscopic imaging as an in vivo probe of sulfur metabolism in living cells. For this work, we have chosen onion (Allium cepa) as a tractable model system with well-developed sulfur biochemistry and present evidence of the localization of a number of different chemical forms. X-ray absorption spectroscopy of onion sections showed increased levels of lachrymatory factor (LF) and thiosulfinate and decreased levels of sulfoxide (LF precursor) following cell breakage. In intact cells, X-ray fluorescence spectroscopic imaging showed elevated levels of sulfoxides in the cytosol and elevated levels of reduced sulfur in the central transport vessels and bundle sheath cells.
Figures


 ). In both (a) and (b) the sulfoxide components of the linear combination fits are shown as broken lines (
 ), and in (b) thiosulfinates a dotted line (
 ) and LF (syn-propanethial S-oxide) as a solid line (
 ). The results of the linear combination analysis are summarized in Table 1.
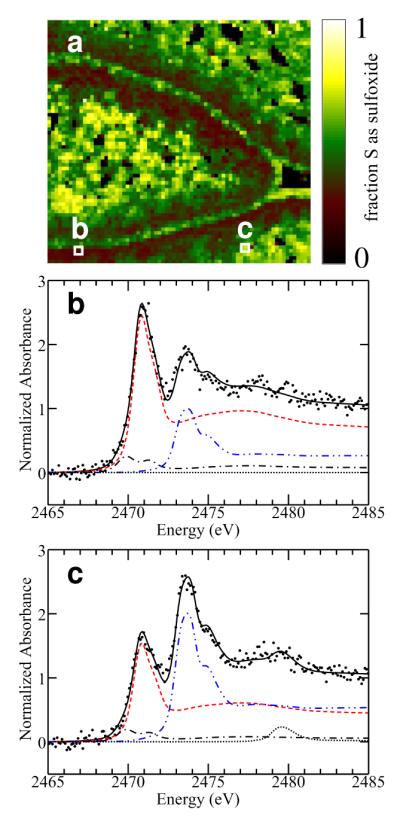
 ), and the components scaled according to their proportions in the fit. These proportions are: (b) 22% sulfoxide (blue
  ), 71% methionine (red
  ), 7% disulfide (black
  ), (sulfate not significant); (c) 46% sulfoxide, 46% methionine, 6% disulfide, 2% sulfate (
 ).
).

Similar articles
-
Silencing onion lachrymatory factor synthase causes a significant change in the sulfur secondary metabolite profile.Plant Physiol. 2008 Aug;147(4):2096-106. doi: 10.1104/pp.108.123273. Epub 2008 Jun 26. Plant Physiol. 2008. PMID: 18583530 Free PMC article.
-
Analysis of sulfur biochemistry of sulfur bacteria using X-ray absorption spectroscopy.Biochemistry. 2001 Jul 10;40(27):8138-45. doi: 10.1021/bi0105532. Biochemistry. 2001. PMID: 11434783
-
X-ray absorption spectroscopy as a probe of microbial sulfur biochemistry: the nature of bacterial sulfur globules revisited.J Bacteriol. 2008 Oct;190(19):6376-83. doi: 10.1128/JB.00539-08. Epub 2008 Aug 1. J Bacteriol. 2008. PMID: 18676668 Free PMC article.
-
Bioactive S-alk(en)yl cysteine sulfoxide metabolites in the genus Allium: the chemistry of potential therapeutic agents.Nat Prod Rep. 2005 Jun;22(3):351-68. doi: 10.1039/b417639c. Epub 2005 May 10. Nat Prod Rep. 2005. PMID: 16010345 Review.
-
Investigations of Sulfur Chemical Status with Synchrotron Micro Focused X-ray fluorescence and X-ray Absorption Spectroscopy.Protein Pept Lett. 2016;23(3):291-9. doi: 10.2174/0929866523666160108120117. Protein Pept Lett. 2016. PMID: 26743629 Review.
Cited by
-
Selenium metabolism in cancer cells: the combined application of XAS and XFM techniques to the problem of selenium speciation in biological systems.Nutrients. 2013 May 21;5(5):1734-56. doi: 10.3390/nu5051734. Nutrients. 2013. PMID: 23698165 Free PMC article. Review.
-
In situ biospectroscopic investigation of rapid ischemic and postmortem induced biochemical alterations in the rat brain.ACS Chem Neurosci. 2015 Feb 18;6(2):226-38. doi: 10.1021/cn500157j. Epub 2014 Nov 13. ACS Chem Neurosci. 2015. PMID: 25350866 Free PMC article.
-
Elemental and chemically specific X-ray fluorescence imaging of biological systems.Chem Rev. 2014 Sep 10;114(17):8499-541. doi: 10.1021/cr4007297. Epub 2014 Aug 7. Chem Rev. 2014. PMID: 25102317 Free PMC article. Review. No abstract available.
-
X-ray absorption spectroscopy at the sulfur K-edge: a new tool to investigate the biochemical mechanisms of neurodegeneration.ACS Chem Neurosci. 2012 Mar 21;3(3):178-85. doi: 10.1021/cn200097s. Epub 2012 Jan 2. ACS Chem Neurosci. 2012. PMID: 22860187 Free PMC article.
-
X-ray absorption spectroscopy of organic sulfoxides.RSC Adv. 2020 Jul 13;10(44):26229-26238. doi: 10.1039/d0ra04653a. eCollection 2020 Jul 9. RSC Adv. 2020. PMID: 35519739 Free PMC article.
References
-
- Voet D, Voet JG. Biochemistry. John Wiley and Sons; New York, Chichester, Brisbane, Toronto, Singapore: 1990.
-
- Bolinger L, Lenkinski RE. Localization in clinical NMR spectroscopy. Biol. Magn. Reson. 1992;11:1–53.
-
- Neubauer S, Horn M, Ertl G, Kochseik K. Clinical significance of cardiac magnetic resonance spectroscopy. Dsch. Med. Wochenschr. 1993;118:1527–1531. - PubMed
-
- Negendank W, Li C-W, Padavic-Shaller K, Murphy-Boesch J, Brown TR. Phospholipid metabolites in 1H-decoupled 31P MRS in vivo in human cancer: implications for experimental models and clinical studies. Anticancer Res. 1996;16:1539–1544. - PubMed
-
- Huxtable RJ. Physiological actions of taurine. Physiol. Rev. 1992;72:101–163. - PubMed
Publication types
MeSH terms
Substances
Grants and funding
LinkOut - more resources
Full Text Sources
