. 2009 May 22:9:30.
doi: 10.1186/1471-213X-9-30.

Extensive molecular differences between anterior- and posterior-half-sclerotomes underlie somite polarity and spinal nerve segmentation

Affiliations

Extensive molecular differences between anterior- and posterior-half-sclerotomes underlie somite polarity and spinal nerve segmentation

Daniel S T Hughes et al. BMC Dev Biol. .

Abstract

Background: The polarization of somite-derived sclerotomes into anterior and posterior halves underlies vertebral morphogenesis and spinal nerve segmentation. To characterize the full extent of molecular differences that underlie this polarity, we have undertaken a systematic comparison of gene expression between the two sclerotome halves in the mouse embryo.

Results: Several hundred genes are differentially-expressed between the two sclerotome halves, showing that a marked degree of molecular heterogeneity underpins the development of somite polarity.

Conclusion: We have identified a set of genes that warrant further investigation as regulators of somite polarity and vertebral morphogenesis, as well as repellents of spinal axon growth. Moreover the results indicate that, unlike the posterior half-sclerotome, the central region of the anterior-half-sclerotome does not contribute bone and cartilage to the vertebral column, being associated instead with the development of the segmented spinal nerves.


Figures

Figure 1
Figure 1
Somite patterning and fate. Somite development involves two patterning systems operating along the A-P and D-V axes. (i) Unsegmented presomite mesoderm and nascent somites showing the oscillations and gradients of gene activity that determine A-P polarity prior to overt somite formation (green: anterior half-somite; red: posterior half-somite). (ii) Transverse section through an A-half-epithelial somite (esm, left) and a differentiated somite (right). Patterning along the D-V axis sub-divides the somite into dermatome (dr), myotome (m) and sclerotome (s). The sclerotome is further sub-divided into ventral (v), central (s, red) and (d) dorsal regions. (iii) Representation of two somites viewed laterally, showing the central sclerotome A-P sub-division. Only the anterior-half (green) is permissive for PNS components. (iv) In differentiated vertebrae, posterior-central sclerotomes form the paired transverse processes and pedicles of the neural arches (red) that encase the spinal cord and provide attachment points for epaxial muscles. Anterior central-sclerotome derivatives (green) contribute to peripheral nerve sheaths and prefigure the positions of the intervertebral foraminae (ivf). Spinous process (sp), intervertebral disc (ivd), vertebral body (vb).
Figure 2
Figure 2
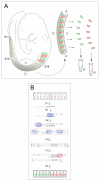
(A) Half-sclerotome dissection. Strips corresponding to the 10–18th most recently formed somites (S10-S18) were isolated from mouse embryos at TS15 (9.5–10.25 d.p.c.). Individual A- (green) or P-sclerotome (red) halves were dissected and pooled for further processing. V, ventral; D, dorsal; A, anterior; P, posterior. (B) Amplification of sclerotome RNA. (i) Total RNA was purified individually from pools of A- or P-half-sclerotomes. (ii) First strand cDNA was synthesized by reverse transcriptase (blue) using a modified Clontech SMART primer containing oligo (dT), a T7 RNA polymerase promoter and an universal primer (UP). (iii) The template-independent addition of 3' C residues allows second strand synthesis by strand-switching of reverse transcriptase using a second UP bearing G residues. (iv) Global cDNA amplification by limited PCR cycles using a UP alone. (v, vi) Further amplification, and generation of antisense-labelled probe by in vitro transcription using T7 polymerase (red) for hybridization to microarrays
Figure 3
Figure 3
Clustering of individual arrays with respect to genes known to shown differentially-expressed in A- or P-half-sclerotomes. Dendrogram of agglomerative hierarchical clustering of individual array hybridization experiments based upon expression data for genes previously reported to show differentially expression between A- and P-sclerotome-halves. The arrays cluster into two distinct groups, and confirm the original identity of the dissected material as A- or P-half-sclerotome.
Figure 4
Figure 4
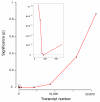
Statistical significance of differential gene expression in the array data. Fisher's exact test was used to explore the null hypothesis that known differentially-expressed genes are not related to their expression values in A- versus P-half-sclerotome. The y-axis shows the probability (p) that a pool of transcripts shows no enrichment of differentially-expressed genes; the lower the p-value the more likely it is to have significant enrichment. The x-axis shows the rank-ordered pool size of transcripts as determined by statistical certainty of differential expression in ascending order. The inset shows an expanded view of the rectangle indicated close to the origin. The dotted line corresponds to p = 10-9. The maximum statistical significance, and thus the minimum estimate for the total number of genes that are differentially-expressed between the two sclerotome halves, is obtained with a pool of ~175 transcripts.
Figure 5
Figure 5
Functional categories of A- and P-sclerotome-half restricted genes. Each A- or P differentially-expressed gene was placed into one of fifteen functional categories based on BLAST and GO database descriptors (grey, P-restricted genes; white, A-restricted genes). A higher proportion of P-half-sclerotome restricted genes fall into functional categories such as development, signal transduction and transcriptional regulation.
Figure 6
Figure 6
Whole-mount in situ hybridization of candidate genes differentially-expressed between A- and P-half-sclerotome. 56 candidate genes were tested for differential expression in A- and P-sclerotome-halves by whole-mount in situ hybridization. The resultant expression patterns were placed into four different groups based upon their certainty of differential expression. Groups 1–3 represent genes with decreasing certainty of differential expression (group 1, high certainty; group 3, low certainty), while group 4 genes show no apparent staining or no observed differential expression. Three examples from each group are shown: Group 1: bmp5, gpc6, plxna2 (green text); Group 2: crabp1, robo1, sox9 (yellow text); Group 3: mospd2, timp3, rab1 (blue text); Group 4: arhgap5, nedd4, slit2 (brown text). Table 1 and Additional File 8 present additional data for the remaining 44 genes.
Figure 7
Figure 7
qPCR analysis of differential expression between sclerotome halves. qPCR was used to assess the relative expression in A- and P-half-sclerotomes of a selection of candidate genes identified from array and ISH experiments. Data for 11 genes with P-half sclerotome enrichment, 3 with A-half enrichment and spondin-1 as a P-half control are shown. Box plots indicate dispersion and skewness of the numerical distribution of expression values. qPCR values from individual experiments were expressed as a fraction of the highest value obtained for that gene in each half-sclerotome. No shading and grey shading indicates the distribution of A-half and P-half expression respectively. The extent of each box represents the middle 50% of the ranked data with the median indicated by a horizontal bar and range by the vertical lines.

References

    1. Christ B, Huang R, Scaal M. Amniote somite derivatives. Dev Dyn. 2007;236:2382–2396. doi: 10.1002/dvdy.21189. - DOI - PubMed
    1. Christ B, Huang R, Wilting J. The development of the avian vertebral column. Anat Embryol (Berl) 2000;202:179–194. doi: 10.1007/s004290000114. - DOI - PubMed
    1. Dequeant ML, Pourquie O. Segmental patterning of the vertebrate embryonic axis. Nat Rev Genet. 2008;9:370–382. doi: 10.1038/nrg2320. - DOI - PubMed
    1. Lewis J, Ozbudak EM. Deciphering the somite segmentation clock: beyond mutants and morphants. Dev Dyn. 2007;236:1410–1415. doi: 10.1002/dvdy.21154. - DOI - PubMed
    1. Ozbudak EM, Pourquie O. The vertebrate segmentation clock: the tip of the iceberg. Curr Opin Genet Dev. 2008;18:317–323. doi: 10.1016/j.gde.2008.06.007. - DOI - PubMed

Publication types