. 2009 Sep;30(26):4287-96.
doi: 10.1016/j.biomaterials.2009.04.040. Epub 2009 May 22.

The influence of degradation characteristics of hyaluronic acid hydrogels on in vitro neocartilage formation by mesenchymal stem cells

Affiliations

The influence of degradation characteristics of hyaluronic acid hydrogels on in vitro neocartilage formation by mesenchymal stem cells

Cindy Chung et al. Biomaterials. 2009 Sep.

Abstract

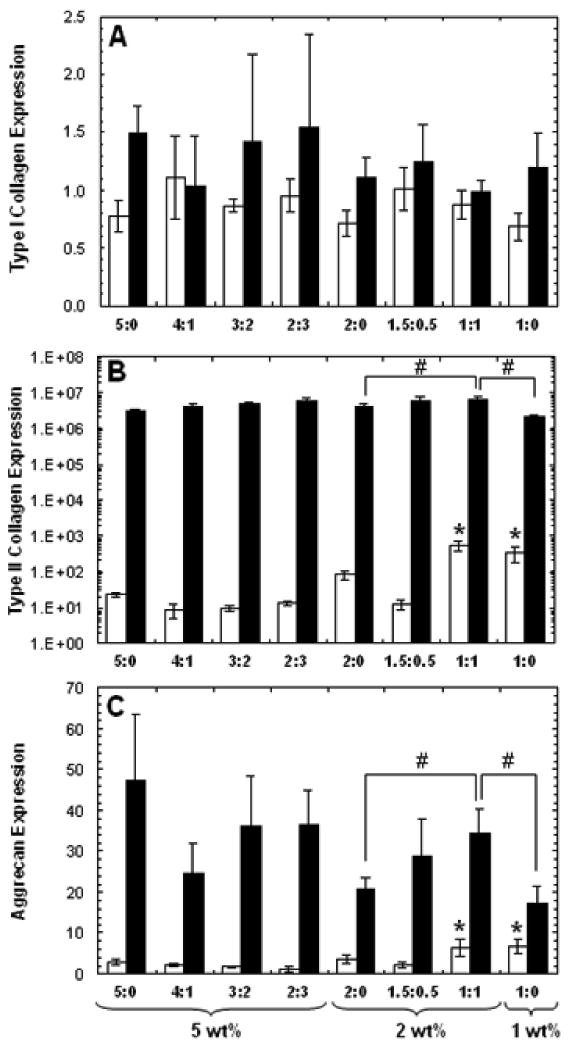
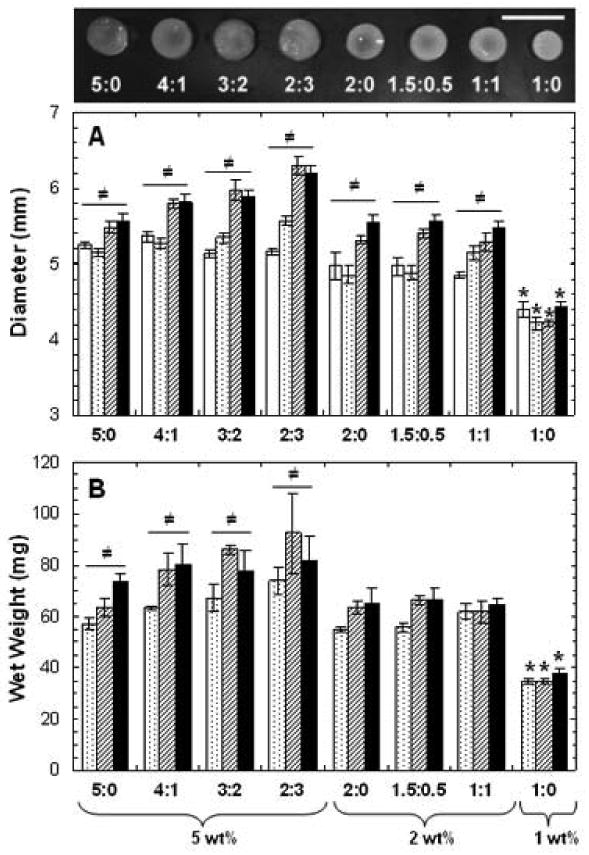
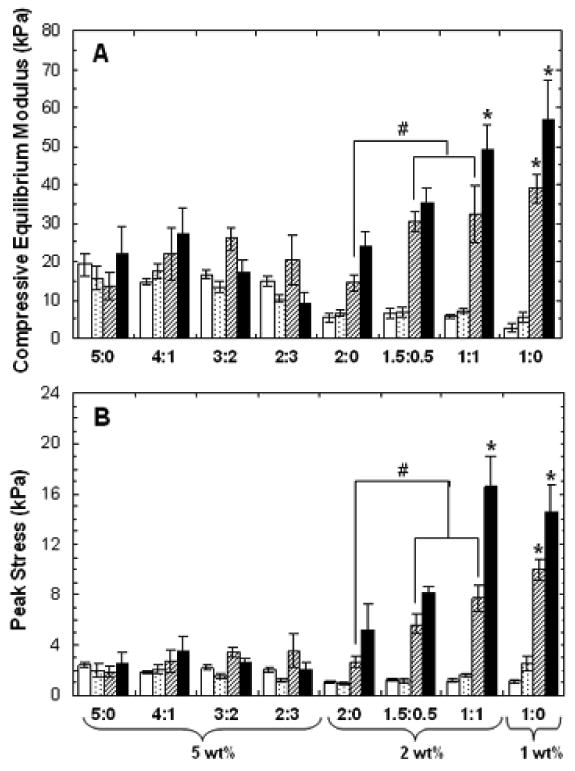
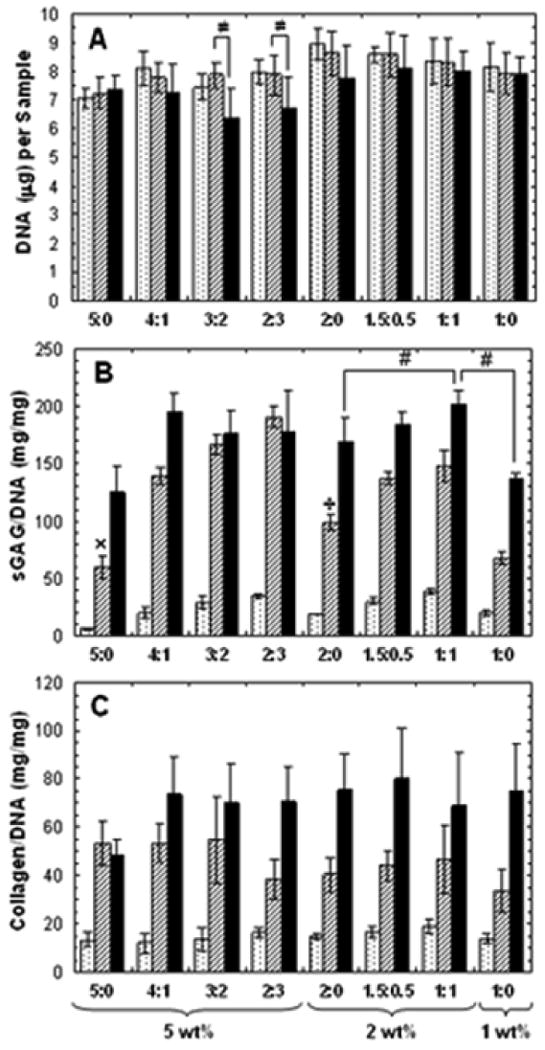
The potential of mesenchymal stem cells (MSCs) as a viable cell source for cartilage repair hinges on the development of engineered scaffolds that support adequate cartilage tissue formation. Evolving networks (hydrogels with mesh sizes that change over time due to crosslink degradation) may provide the control needed to enhance overall tissue formation when compared to static scaffolds. In this study, MSCs were photoencapsulated in combinations of hydrolytically and enzymatically degradable hyaluronic acid (HA) hydrogels to investigate the tunability of these hydrogels and the influence of network evolution on neocartilage formation. In MSC-laden HA hydrogels, compressive mechanical properties increased when degradation complemented extracellular matrix deposition and decreased when degradation was too rapid. In addition, dynamic hydrogels that started at a higher wt% and decreased to a lower wt% were not equivalent to static hydrogels that started at the higher or lower wt%. Specifically, evolving 2 wt% hydrogels (2 wt% degrading to 1 wt%) expressed up-regulation of type II collagen and aggrecan, and exhibited increased glycosaminoglycan content over non-evolving 2 and 1 wt% hydrogels. Likewise, mechanical properties and size maintenance were superior in the dynamic system compared to the static 2 wt% and 1 wt% hydrogels, respectively. Thus, hydrogels with dynamic properties may improve engineered tissues and help translate tissue engineering technology to clinical application.


Figures

Figure 1
Figure 1
Synthetic scheme for the MeCLHA macromer (A). 1H NMR of the MeCLHA macromer (n= ∼3.8, ∼7.5% modification) (B). % modification was determined by the integration of methacrylate peaks and the peaks associated with the HA backbone.
Figure 2
Figure 2
Degradation (n=3) of acellular 2 wt% MeHA (black) and 2 wt% MeCLHA (white) hydrogels (A) measured by uronic acid release. Degradation of acellular 5:0 (black) and 2:3 (white) MeHA wt%: MeCLHA wt% hydrogels (B). Hyaluronidase addition at 56 days is denoted by the dashed line. Values are reported as mean ± standard deviation.
Figure 3
Figure 3
Elastic moduli (n=5) of acellular HA hydrogels after 1 (white), 7 (gray), and 14 days (shaded) of incubation in PBS at 37°C. Statistical analysis of relevant comparisons: ≠ denotes significant difference over time between bracketed groups. Values are reported as mean ± standard deviation.
Figure 4
Figure 4
Representative live (green)/dead (red) staining of HA hydrogels after 1 and 14 days of culture. Scale bar = 200μm.
Figure 5
Figure 5
Relative gene expression of (A) type I collagen, (B) type II collagen, and (C) aggrecan for all HA hydrogel formulations after 3 (white) and 14 (black) days of culture. Each sample was internally normalized to GAPDH, and each group was normalized to expression of MSCs isolated at the time of encapsulation. Statistical analysis of relevant comparisons: * denotes significant difference between starred groups and all other groups for the specified time point and # denotes significant difference between bracketed groups. Relative gene expression of type II collagen for 5, 2, and 1 wt% MeHA only hydrogels were also all significantly different from each other at day 14. Values are reported as mean ± standard deviation.
Figure 6
Figure 6
Macroscopic appearance of hydrogels after 8 weeks of in vitro culture (scale bar = 1cm) (top). Diameter (A) and wet weight (B) of hydrogels after 1 (white), 14 (dotted), 35 (striped), and 56 (black) days of in vitro culture (n=5). Values are reported as mean ± standard deviation. Statistical analysis of relevant comparisons: * denotes significant difference between starred groups and all other groups for the specified time point and ≠ denotes significant difference over time within each group.
Figure 7
Figure 7
Compressive equilibrium moduli (A) and peak stresses (B) of hydrogels at 1 (white), 14 (dotted), 35 (striped), and 56 (black) days of in vitro culture (n=5). Values are reported as mean ± standard deviation. Statistical analysis or relevant comparisons: * denotes significant difference between starred groups and all other groups for the specified time point and # denotes significant difference between bracketed groups. Significant increases in both moduli and peak stresses over time within each formulation were also observed for all 2 and 1 wt% groups (not denoted). Significant decrease in moduli for 2:3 hydrogels from day 35 to day 56 was also observed (not denoted).
Figure 8
Figure 8
DNA (A), sulfated GAG/DNA (B), and collagen/DNA (C) contents of hydrogels at 14 (dotted), 35 (striped), and 56 (black) days of in vitro culture (n=5). Values are reported as mean ± standard deviation. Statistical analysis of relevant comparisons: * denotes significant difference between starred groups and all other groups for the specified time point, # denotes significant difference between bracketed groups, ≠ denotes significant difference over time between bracketed groups, ÷ denotes significant difference between marked group and all other 2wt% groups, and × denotes significant difference between marked group an all other 5 wt% groups. Significant increases in collagen/DNA content over time was observed for all groups (not denoted).
Figure 9
Figure 9
Immunohistochemical staining of chondroitin sulfate (CS) and type II collagen (C2) for 2 and 8 weeks of culture. Scale bar = 100μm.

References

    1. Chung C, Burdick JA. Engineering cartilage tissue. Adv Drug Deliver Rev. 2008;60(2):243–62. - PMC - PubMed
    1. Mauck RL, Yuan X, Tuan RS. Chondrogenic differentiation and functional maturation of bovine mesenchymal stem cells in long-term agarose culture. Osteoarthritis and Cartilage. 2006;14(2):179–89. - PubMed
    1. Smeds KA, Pfister-Serres A, Miki D, Dastgheib K, Inoue M, Hatchell DL, et al. Photocrosslinkable polysaccharides for in situ hydrogel formation. J Biomed Mater Res. 2001;54(1):115–21. - PubMed
    1. Burdick JA, Chung C, Jia XQ, Randolph MA, Langer R. Controlled degradation and mechanical behavior of photopolymerized hyaluronic acid networks. Biomacromolecules. 2005;6(1):386–91. - PMC - PubMed
    1. Chung C, Erickson IE, Mauck RL, Burdick JA. Differential behavior of auricular and articular chondrocytes in hyaluronic acid hydrogels. Tissue Eng Pt A. 2008;14(7):1121–31. - PMC - PubMed

Publication types

MeSH terms