. 2009 Jun 15;180(2):208-23.
doi: 10.1016/j.jneumeth.2009.03.019. Epub 2009 Mar 31.

A 4-dimensional representation of antennal lobe output based on an ensemble of characterized projection neurons

Affiliations

A 4-dimensional representation of antennal lobe output based on an ensemble of characterized projection neurons

Erich M Staudacher et al. J Neurosci Methods. .

Abstract

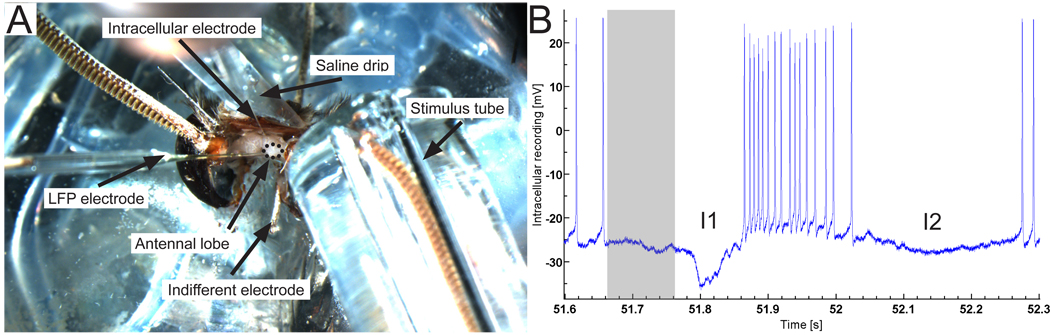
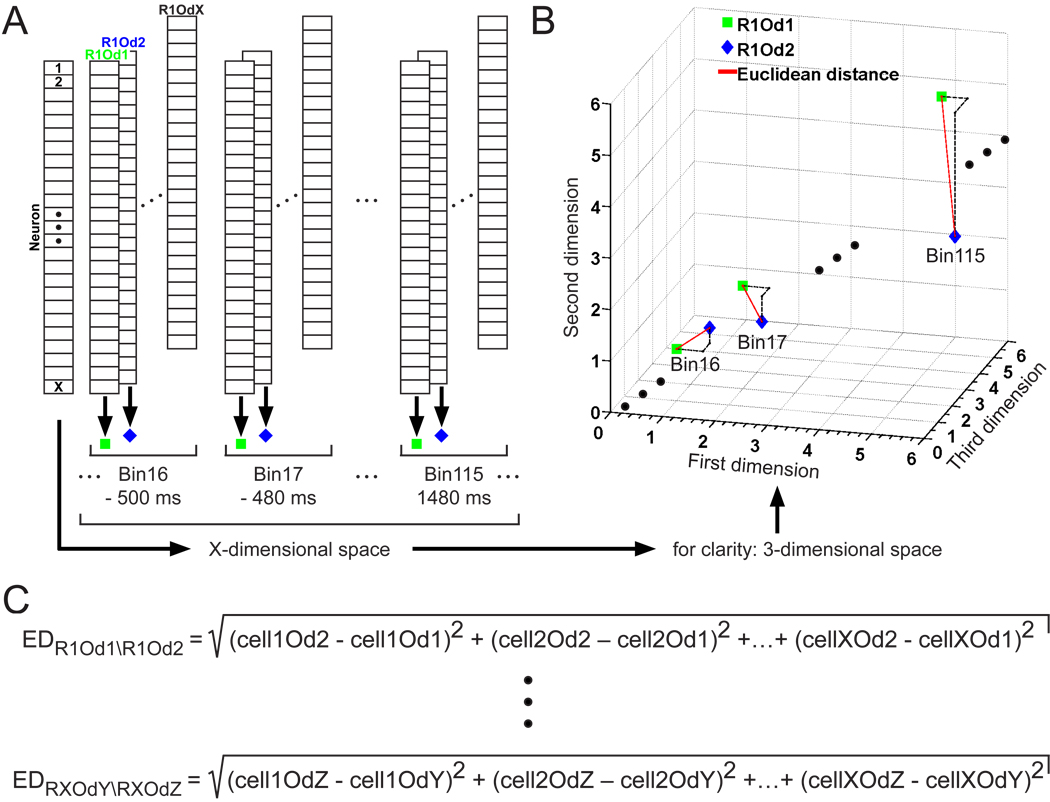
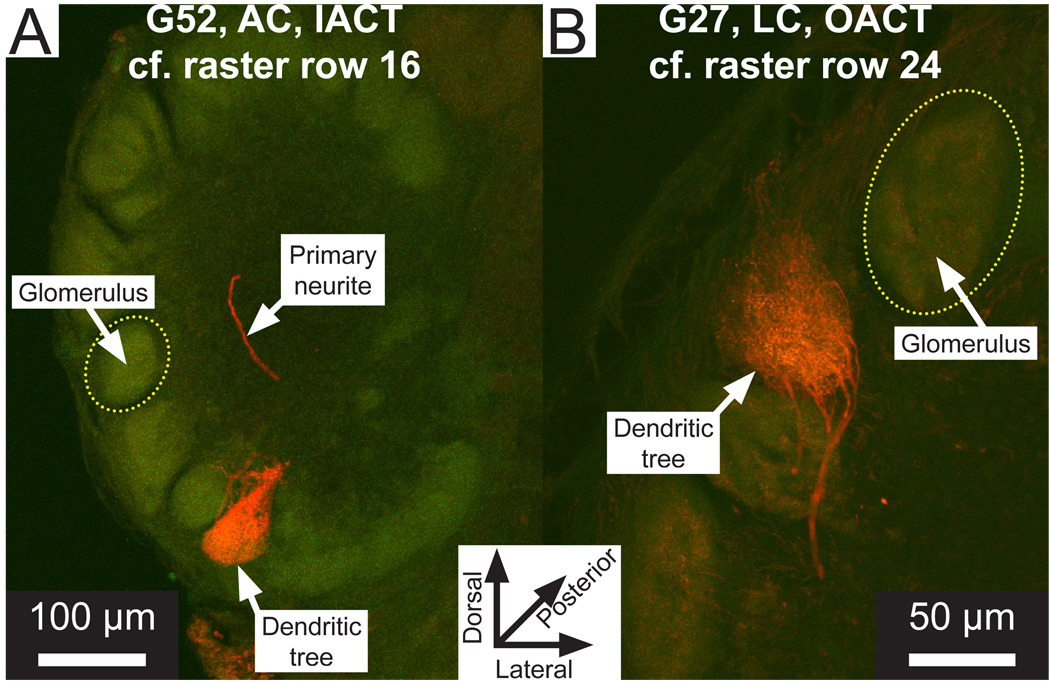
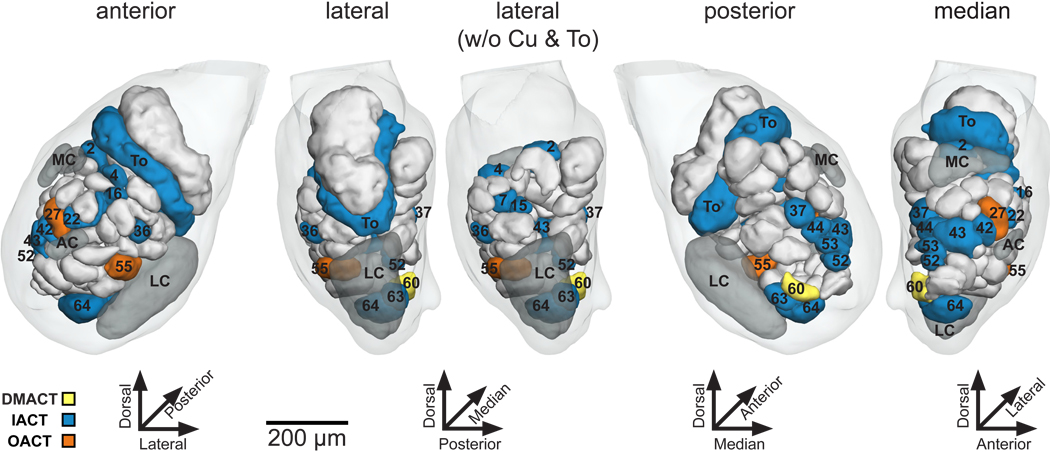
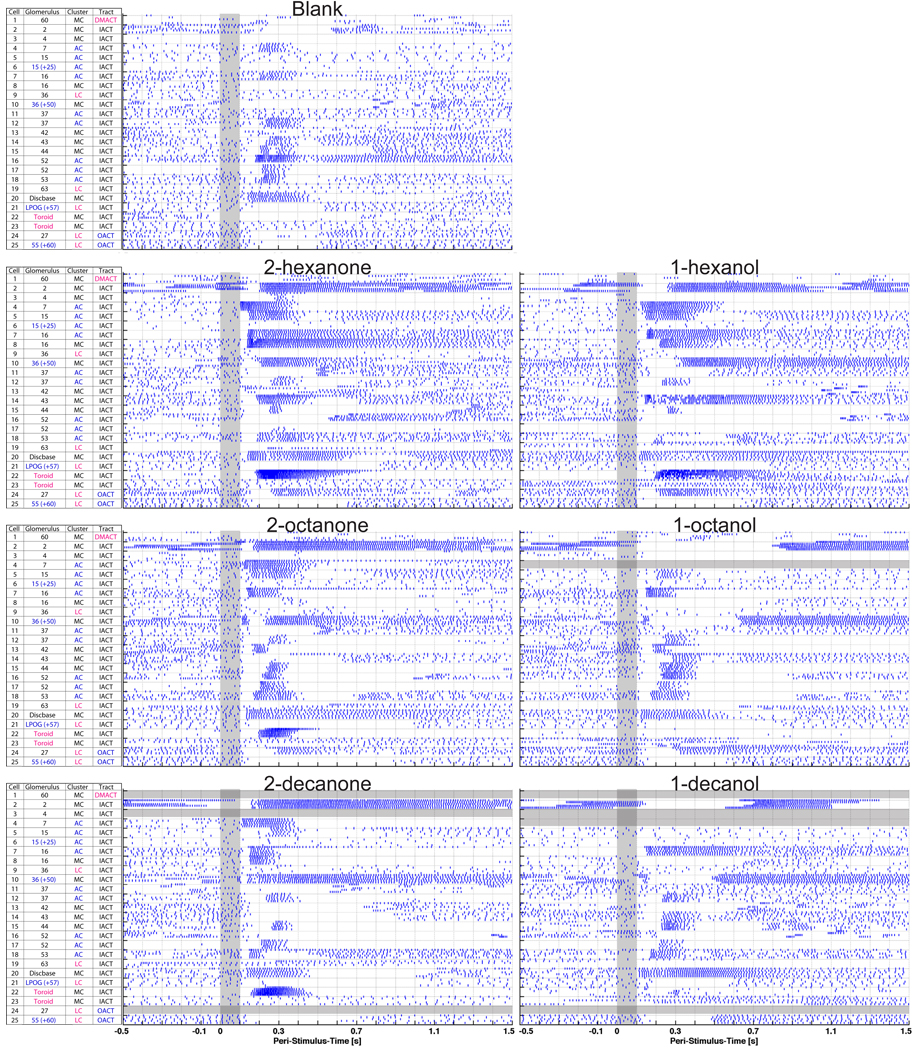
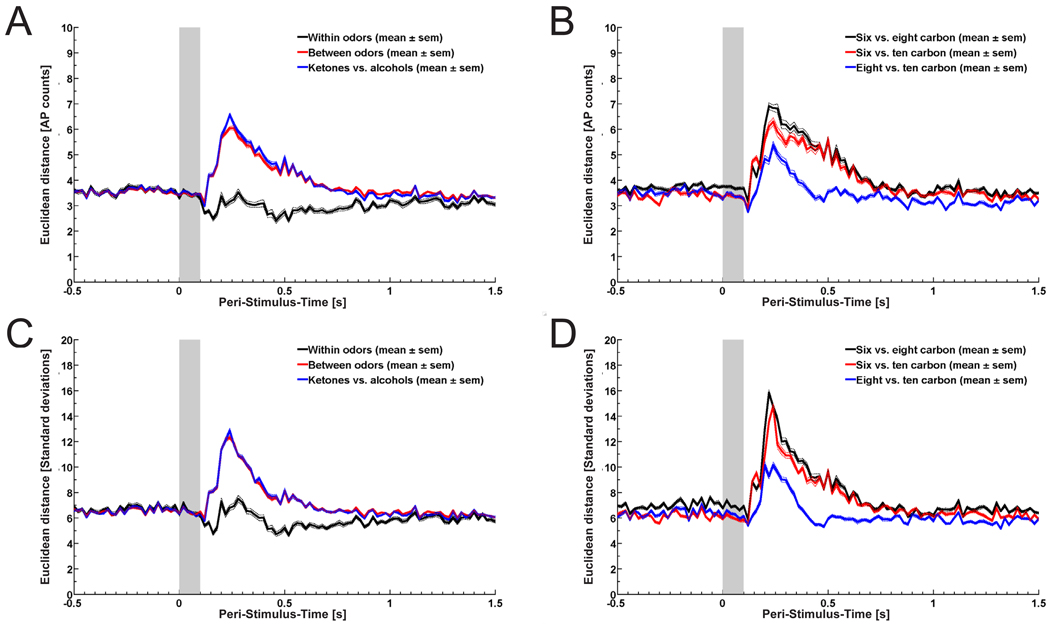
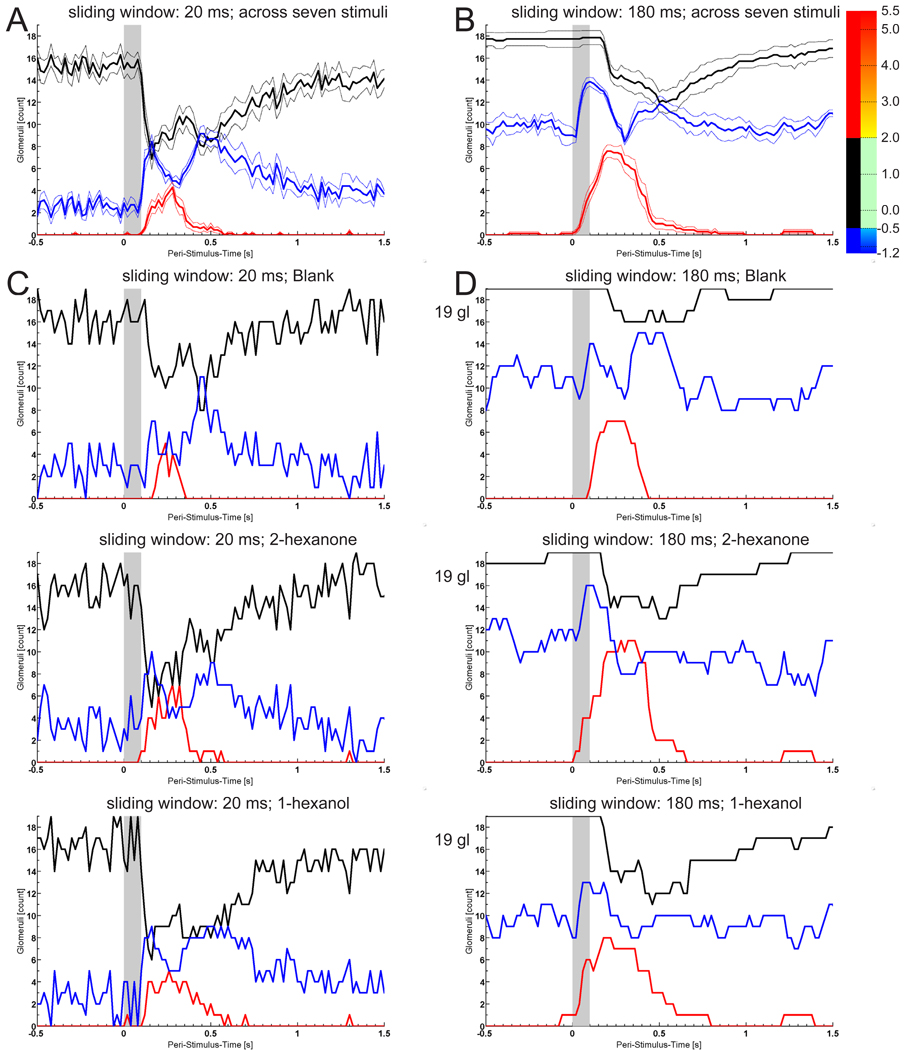
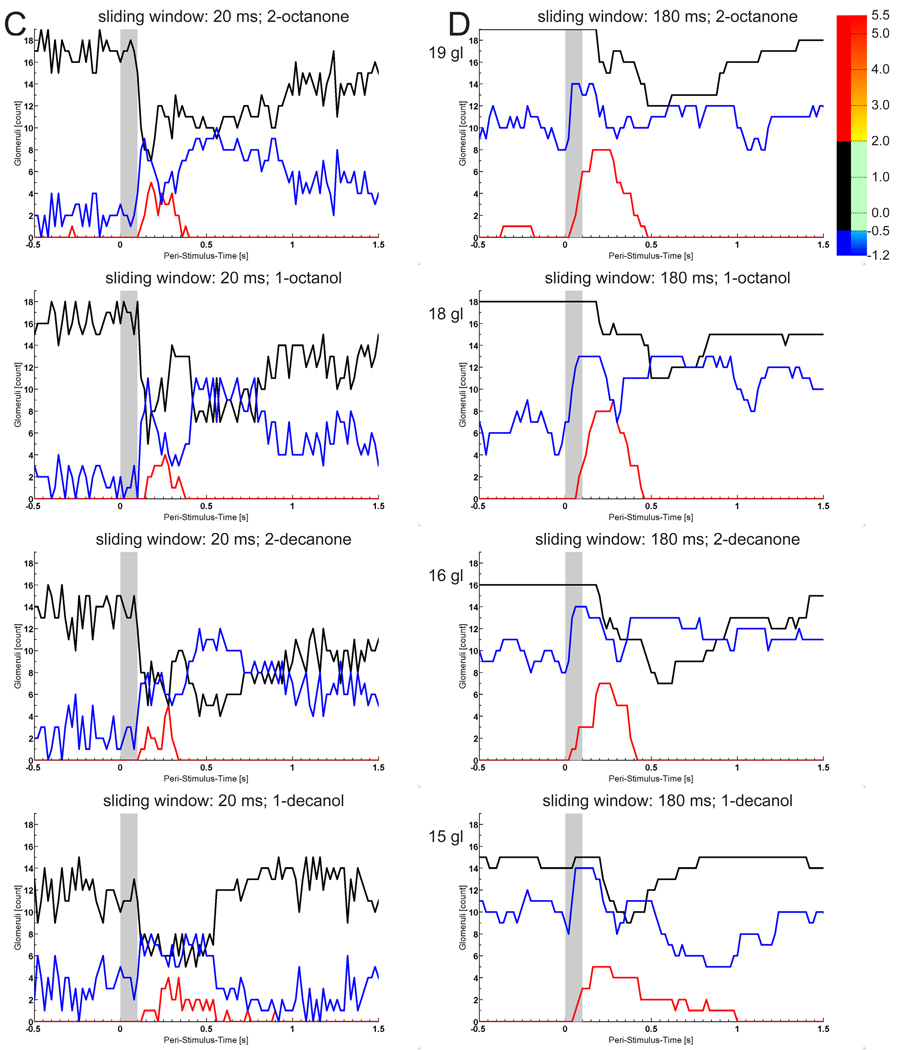
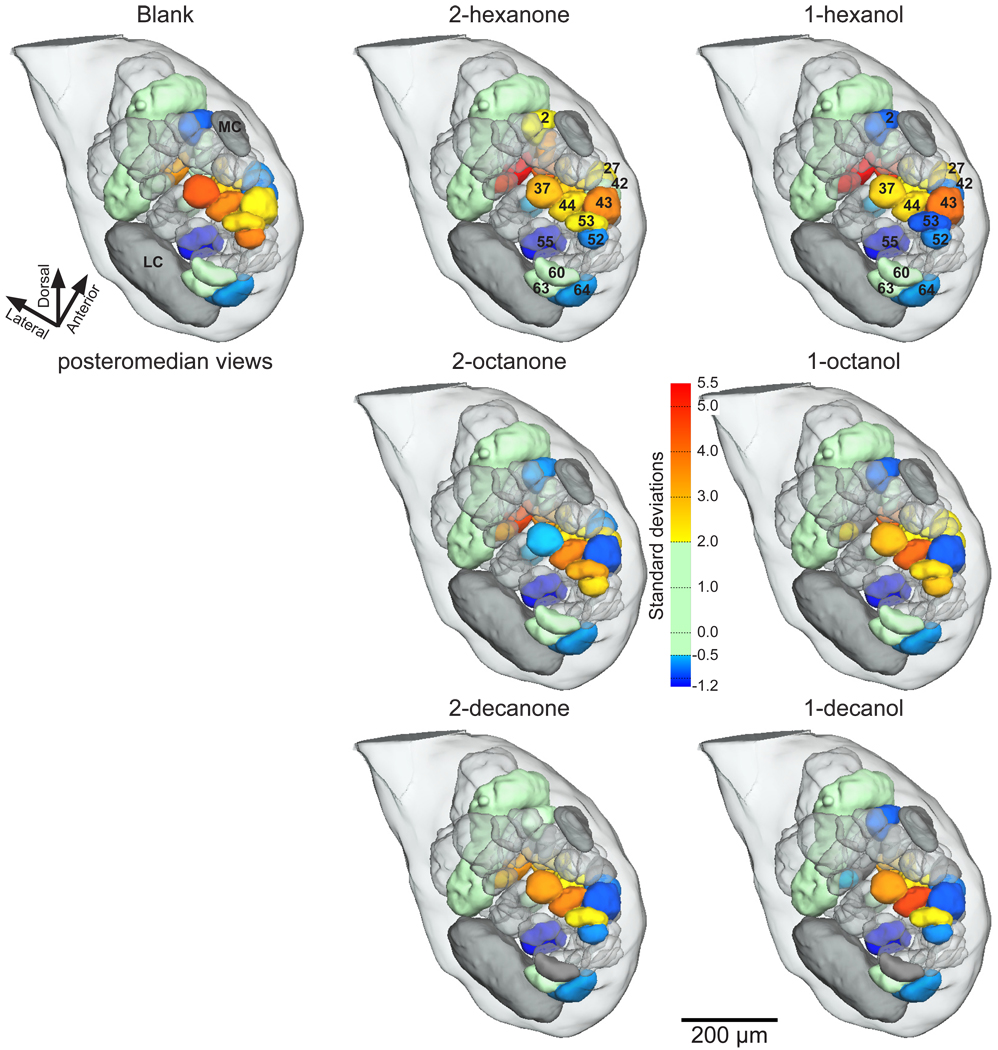
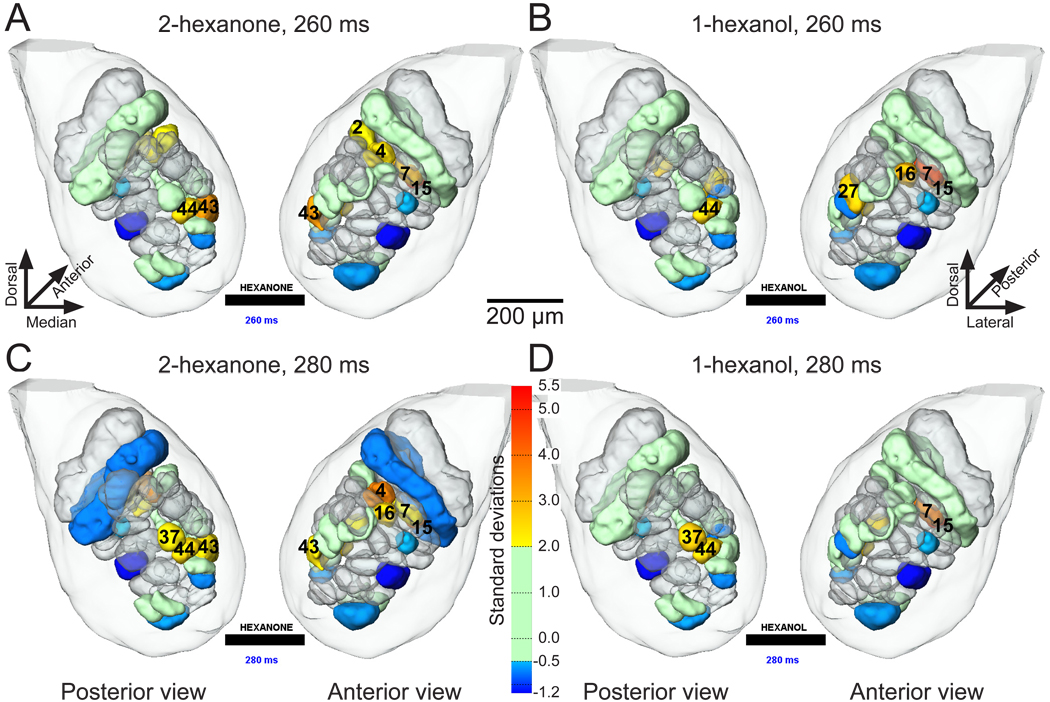
A central problem facing studies of neural encoding in sensory systems is how to accurately quantify the extent of spatial and temporal responses. In this study, we take advantage of the relatively simple and stereotypic neural architecture found in invertebrates. We combine standard electrophysiological techniques, recently developed population analysis techniques, and novel anatomical methods to form an innovative 4-dimensional view of odor output representations in the antennal lobe of the moth Manduca sexta. This novel approach allows quantification of olfactory responses of characterized neurons with spike time resolution. Additionally, arbitrary integration windows can be used for comparisons with other methods such as imaging. By assigning statistical significance to changes in neuronal firing, this method can visualize activity across the entire antennal lobe. The resulting 4-dimensional representation of antennal lobe output complements imaging and multi-unit experiments yet provides a more comprehensive and accurate view of glomerular activation patterns in spike time resolution.


Figures

Fig. 1
Fig. 1
(A) The photograph of the preparation shows brain with the antennal lobe, the glass tube with the left flagellum inserted and other details of the recording situation. (B) The original recording of an odor driven response of a projection neuron shows the low spontaneous activity, a strong, high frequency response, and both I1 and I2 inhibition. Abbreviations: I1(2) inhibition No. 1 (2, respectively).
Fig. 2
Fig. 2
(A) At each peri-stimulus time bin for all repeats of all stimuli, the action potential count/z-score value of each neuron of the ensemble represents one coordinate value for a single point in a space, the dimensionality of which is equal to the size of the ensemble. (B) Red lines represent the Euclidean distances between two points of the same peri-stimulus time bin for two fictive responses (green and blue points). To illustrate the principle, Euclidean distances between corresponding points are exemplified in a 3-dimensional space. (C) Euclidean distances between corresponding points were calculated according to the Pythagorean theorem. This calculation was performed on every odor and repeat comparison to provide both within odor and between odor distance values at each peri-stimulus time bin. Abbreviations: ED: Euclidean distance; R1(X)Od1(2,Y,Z): repeat one (X) for odor one (two, Y, Z).
Fig. 3
Fig. 3
(A, B) Two examples of recorded and filled projection neurons. Maximum projections show the dendritic trees of two projection neurons (red) and the outlines of antennal lobe glomeruli (green). Yellow dotted lines indicate the borders of two arbitrarily chosen individual glomeruli. Abbreviations: AC/LC anterior/lateral soma cluster; IACT/OACT: inner/outer antennocerebral tract; G52, G27: identity of innervated glomerulus.
Fig. 4
Fig. 4
Colored and numbered glomeruli in these four views of the 3-dimensional reference antennal lobe represent the locations of the dendritic trees of the uniglomerular projection neurons recorded and stained in this study. The three colors represent the output tracts through which the axons of these neurons leave the antennal lobe and project to the protocerebrum. Abbreviations: AC/LC/MC anterior/lateral/median soma cluster; Cu: Cumulus; DMACT/IACT/OACT: dorsomedian/inner/outer antennocerebral tract; To: Toroid.
Fig. 5
Fig. 5
Raster plots of odor dependent changes in the responses of single projection neurons and, consequently, of the virtual ensemble. Stimulus marker: grey vertical bar. Tables on the left side of the plots provide details on the glomerulus, in which the corresponding projection neuron ramified in, soma cluster and output tract. Horizontal grey bars indicate specific stimuli that were not tested in a given projection neuron. Abbreviations: AC/LC/MC anterior/lateral/median soma cluster; DMACT/IACT/OACT: dorsomedian/inner/outer antennocerebral tract.
Fig. 6
Fig. 6
Plots of Euclidean distance based on binned (20 ms) action potential data (A and B) and z-score transformed data (C and D) show that response dynamics is well preserved in z-score data and that this virtual ensemble could discriminate different odors very well. Stimulus marker: grey vertical bar. Abbreviation: AP: action potential; sem: standard error of the mean.
Fig. 7
Fig. 7
Z-score transformed data were used to quantify how many neurons increased, stopped or did not change their firing at each bin of the peri-stimulus-time. For this, the normalized z-score colorbar was broken into three regions: red: increased firing, ≥ 2; blue: pause in firing, ≤ −0.5; black: no change, > −0.5 and < 2.0 standard deviations. (A, B) Neuron counts within sliding windows of 20 ms (A) and 180 ms (B) averaged across the seven stimuli (blank and the six odors: n=7; 15 to 19 glomeruli). Data are plotted as means ± 57 standard error of the mean (broken lines). (C, D) The same sliding windows (C: 20 ms; D: 180 ms) were used for the separate counts for each stimulus. Abbreviations: gl: number of glomeruli included in each of these counts.
Fig. 7
Fig. 7
Z-score transformed data were used to quantify how many neurons increased, stopped or did not change their firing at each bin of the peri-stimulus-time. For this, the normalized z-score colorbar was broken into three regions: red: increased firing, ≥ 2; blue: pause in firing, ≤ −0.5; black: no change, > −0.5 and < 2.0 standard deviations. (A, B) Neuron counts within sliding windows of 20 ms (A) and 180 ms (B) averaged across the seven stimuli (blank and the six odors: n=7; 15 to 19 glomeruli). Data are plotted as means ± 57 standard error of the mean (broken lines). (C, D) The same sliding windows (C: 20 ms; D: 180 ms) were used for the separate counts for each stimulus. Abbreviations: gl: number of glomeruli included in each of these counts.
Fig. 8
Fig. 8
Posteromedian views of the 3-dimensional reference antennal lobe show representations of stimulus driven projection neuron activity for each condition, i.e. blank and six odors. Glomeruli are colored according to the normalized zscore colorbar. Their colors indicate the maximum z-score value for each glomerulus within the time window between 100 and 400 ms after stimulus onset. Abbreviations: LC/MC lateral/median soma cluster.
Fig. 9
Fig. 9
Pictures of four frames from the animations illustrate how activity patterns change in odor (A, C vs. B, D) and time (A vs. C and B vs. D) dependent ways. Animations (http://www.JNeurosciMeth...). Peri-stimulus-time movies of glomerular output show responses (z-score false-color coded) to the six odors and a blank in an anatomically correct 4-dimensional representation of the antennal lobe. In all animations, the antennal lobe reference atlas is shown as anterior and posterior view (right and left, respectively). In the beginning, the neurilemma is shown as the translucent outer border of each antennal lobe and glomeruli from which we have projection neuron recordings are color-coded according to the output tract the axon was located in. Abbreviated labels for these output-tracts are shown in the upper middle part of this view. Glomeruli, from which we currently have no recordings from, are translucent. The three soma clusters are shown as dark grey structures. The colorbar on the right side is based on the z-score transformation of neural activity and, thus, is in standard deviations. Note that warm colors (yellow to red) represent significant excitation (z-score ≥ 2 standard deviations), blue tones represent decreased or no firing (z-score ≤ −0.5 standard deviations) and green marks fluctuations around the mean (−0.5 < z-score < 2 standard deviations). During the main part of each animation, scale bars, tract information and soma clusters are omitted for clarity. Peri-stimulus-time is shown relative to the beginning of the odor stimulus at 0 ms, ranges from −500 to 1480 ms and increases in 20 ms steps. The odorant used for stimulation is displayed above the stimulus bar in the lower middle of the screen and both turn red during the 100 ms long odor stimulation. Note that from time 0 to 400 ms the frame rate is reduced to aid in observing the spatio-temporal dynamics of glomerular activity. In a few cases, some glomeruli are marked in medium grey, which means that data are missing for this particular odor. Abbreviations: DMACT/IACT/OACT: dorsomedian/inner/outer antennocerebral tract; stdev: standard deviation.

Similar articles

Cited by

References

    1. Anton S, Hansson BS. Central processing of sex-pheromone, host odor, and oviposition deterrent information by interneurons in the antennal lobe of female Spodoptera littoralis (Lepidoptera, Noctuidae) J Comp Neurol. 1994;350:199–214. - PubMed
    1. Anton S, Homberg U. Antennal lobe structure. In: Hansson BS, editor. Insect olfaction. New York: Springer: Berlin; 1999. pp. 97–124.
    1. Berg BG, Galizia CG, Brandt R, Mustaparta H. Digital atlases of the antennal lobe in two species of tobacco budworm moths, the oriental Helicoverpa assulta (male) and the american Heliothis virescens (male and female) J Comp Neurol. 2002;446:123–134. - PubMed
    1. Boehm H, Schildberger K. Brain neurons involved in the control of walking in the cricket Gryllus bimaculatus. J Exp Biol. 1992;166:113–130.
    1. Bonhoeffer T, Grinvald A. The layout of iso-orientation domains in area-18 of cat visual-cortex - optical imaging reveals a pinwheel-like organization. J Neurosci. 1993;13:4157–4180. - PMC - PubMed

Publication types

MeSH terms

Substances

LinkOut - more resources