Review
. 2009 Jun 19;42(9):1163-76.
doi: 10.1016/j.jbiomech.2009.04.040. Epub 2009 May 22.

The role of interstitial fluid pressurization in articular cartilage lubrication

Affiliations
Review

The role of interstitial fluid pressurization in articular cartilage lubrication

Gerard A Ateshian. J Biomech. .

Abstract

Over the last two decades, considerable progress has been reported in the field of cartilage mechanics that impacts our understanding of the role of interstitial fluid pressurization on cartilage lubrication. Theoretical and experimental studies have demonstrated that the interstitial fluid of cartilage pressurizes considerably under loading, potentially supporting most of the applied load under various transient or steady-state conditions. The fraction of the total load supported by fluid pressurization has been called the fluid load support. Experimental studies have demonstrated that the friction coefficient of cartilage correlates negatively with this variable, achieving remarkably low values when the fluid load support is greatest. A theoretical framework that embodies this relationship has been validated against experiments, predicting and explaining various outcomes, and demonstrating that a low friction coefficient can be maintained for prolonged loading durations under normal physiological function. This paper reviews salient aspects of this topic, as well as its implications for improving our understanding of boundary lubrication by molecular species in synovial fluid and the cartilage superficial zone. Effects of cartilage degeneration on its frictional response are also reviewed.


Figures

Fig. 1
Fig. 1
Confined compression creep response of bovine articular cartilage. (a) Creep deformation versus time; symbols denote experimental data and the solid curve represents a curve-fit of the experimental response using the biphasic theory. (b) Ratio of interstitial fluid pressure to applied stress, at the cartilage face abutting the bottom of the confining chamber; symbols denote experimental measurements and the solid curve represents the predicted response from the biphasic theory, using the material coefficients HA and k obtained from curve-fitting the creep response. Reproduced from (Soltz and Ateshian, 1998) with permission.
Fig. 2
Fig. 2
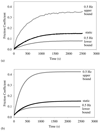
Time-dependent response of the friction coefficient of articular cartilage plugs (∅︀9 mm) against a metal counterface, under a constant applied load of 30 N, with reciprocal sliding of ±25 mm at 4 mm/s, using either Ringer’s solution or synovial fluid as the bathing solution. Reproduced from (Forster and Fisher, 1999) with permission.
Fig. 3
Fig. 3
(a) Time-dependent response of the friction coefficient μeff and interstitial fluid load support Wp/W of articular cartilage plugs (∅︀6 mm) against glass, under a constant applied load of 4.5 N, with reciprocal sliding of ±2 mm at 1 mm/s. (b) A plot of μeff versus Wp/W yields a linear variation, consistent with the model of Eq.(9).
Fig. 4
Fig. 4
(a) Experimental measurements of the coefficient of friction of a cartilage plug (∅︀4.8 mm) against glass, under a constant load of 13.4 N, or a sinusoidal load varying from 4.5 N to 22.3 N at 0.5 Hz, with reciprocal sliding of ±4.5 mm at 1 mm/s. (b) Theoretical predictions of the friction coefficient, using Eq.(9) and the biphasic-CLE model (Soltz and Ateshian, 2000a) to estimate Wp/W . Reproduced from (Krishnan et al., 2005) with permission.
Fig. 5
Fig. 5
(a) Temporal response of the normalized friction coefficient (μeff/μeq) of a cartilage plug against glass, for various plug diameters (∅︀4, 6 and 8 mm), under a constant applied stress of 0.25 MPa, with reciprocal sliding of ±4.5 mm at 1 mm/s. (b) A plot of the time constant τμ for the rise of the friction coefficient versus the size of the contact area, for two different applied stresses, shows a linear response. Reproduced from (Carter et al., 2007) with permission.
Fig. 6
Fig. 6
Comparison of the temporal response of the friction coefficient of cartilage in a loading configuration maintaining a stationary contact area on cartilage (SCA, bovine femoral condyle translating against glass) versus ones that promote a migrating contact area (MCA, glass lens translating over bovine tibial plateau, or femoral condyle translating against tibial plateau), under a constant applied load of 6.3 N, with reciprocal sliding of ±4 mm for SCA, ±10 mm for MCA, at 1 mm/s. The friction coefficient remains nearly constant under MCA, but increases to an equilibrium value under SCA. Reproduced from (Caligaris and Ateshian, 2008a) with permission.
Fig. 7
Fig. 7
Friction coefficient between bovine femoral condyle and tibial plateau under the configuration of migrating contact area, under a constant applied load of 6.3 N, with reciprocal sliding of ±10 mm, at four different sliding speeds (0.005, 0.05, 0.5 and 5 mm/s). The Peclet number Pe = Va/HAk was estimated using cartilage properties from the prior literature (Soltz and Ateshian, 2000a), and a ~ 2 mm. Reproduced from (Caligaris and Ateshian, 2008a) with permission.
Fig. 8
Fig. 8
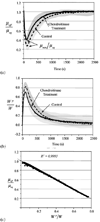
(a) Friction coefficient of control and chondroitinase-ABC digested cartilage plugs against glass, under a prescribed ramp-and-hold deformation profile producing a stress-relaxation response, with reciprocal sliding of ±1.5 mm at 1 mm/s. A tare load was initially applied to the samples, which was allowed to equilibrate, explaining why μeff= μeq at the initiation of sliding. The ratio μmineq was statistically higher in the digested cartilage group. (b) The interstitial fluid load support, estimated from the experimental load-deformation response using a relationship derived from the biphasic-CLE theory (Soltz and Ateshian, 2000a), exhibited a significantly lower peak in the digested group. (c) A parametric plot of μeffeq versus Wp/W for a representative digested sample exhibits the characteristic linear response predicted from Eq. (9), demonstrating excellent agreement between theory and experiments. Reproduced from (Basalo et al., 2005) with permission.

References

    1. Ahmed AM, Burke DL. In-vitro measurement of static pressure distribution in synovial joints--Part I: Tibial surface of the knee. J Biomech Eng. 1983;105:216–225. - PubMed
    1. Ahmed AM, Burke DL, Yu A. In-vitro measurement of static pressure distribution in synovial joints--Part II: Retropatellar surface. J Biomech Eng. 1983;105:226–236. - PubMed
    1. Almeida ES, Spilker RL. Mixed and Penalty Finite Element Models for the Nonlinear Behavior of Biphasic Soft Tissues in Finite Deformation: Part I - Alternate Formulations. Comput Methods Biomech Biomed Engin. 1997;1:25–46. - PubMed
    1. Armstrong CG, Lai WM, Mow VC. An analysis of the unconfined compression of articular cartilage. J Biomech Eng. 1984;106:165–173. - PubMed
    1. Ateshian GA. A theoretical formulation for boundary friction in articular cartilage. J Biomech Eng. 1997;119:81–86. - PubMed

Publication types

Substances