. 2009 Jul;75(14):4801-12.
doi: 10.1128/AEM.01376-08. Epub 2009 May 22.

Viral and flagellate control of prokaryotic production and community structure in offshore Mediterranean waters

Affiliations

Viral and flagellate control of prokaryotic production and community structure in offshore Mediterranean waters

Osana Bonilla-Findji et al. Appl Environ Microbiol. 2009 Jul.

Abstract

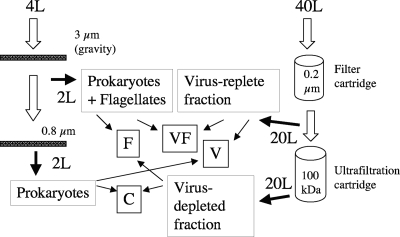
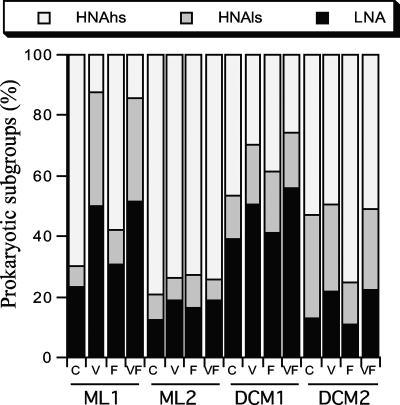
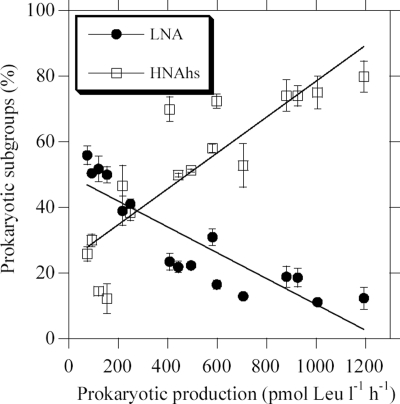
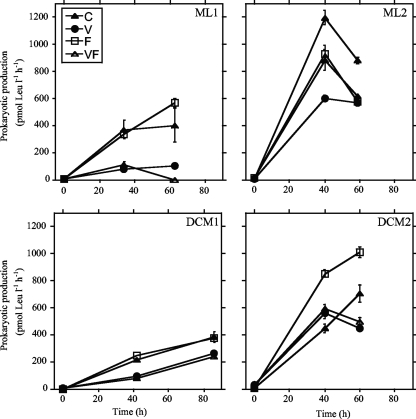
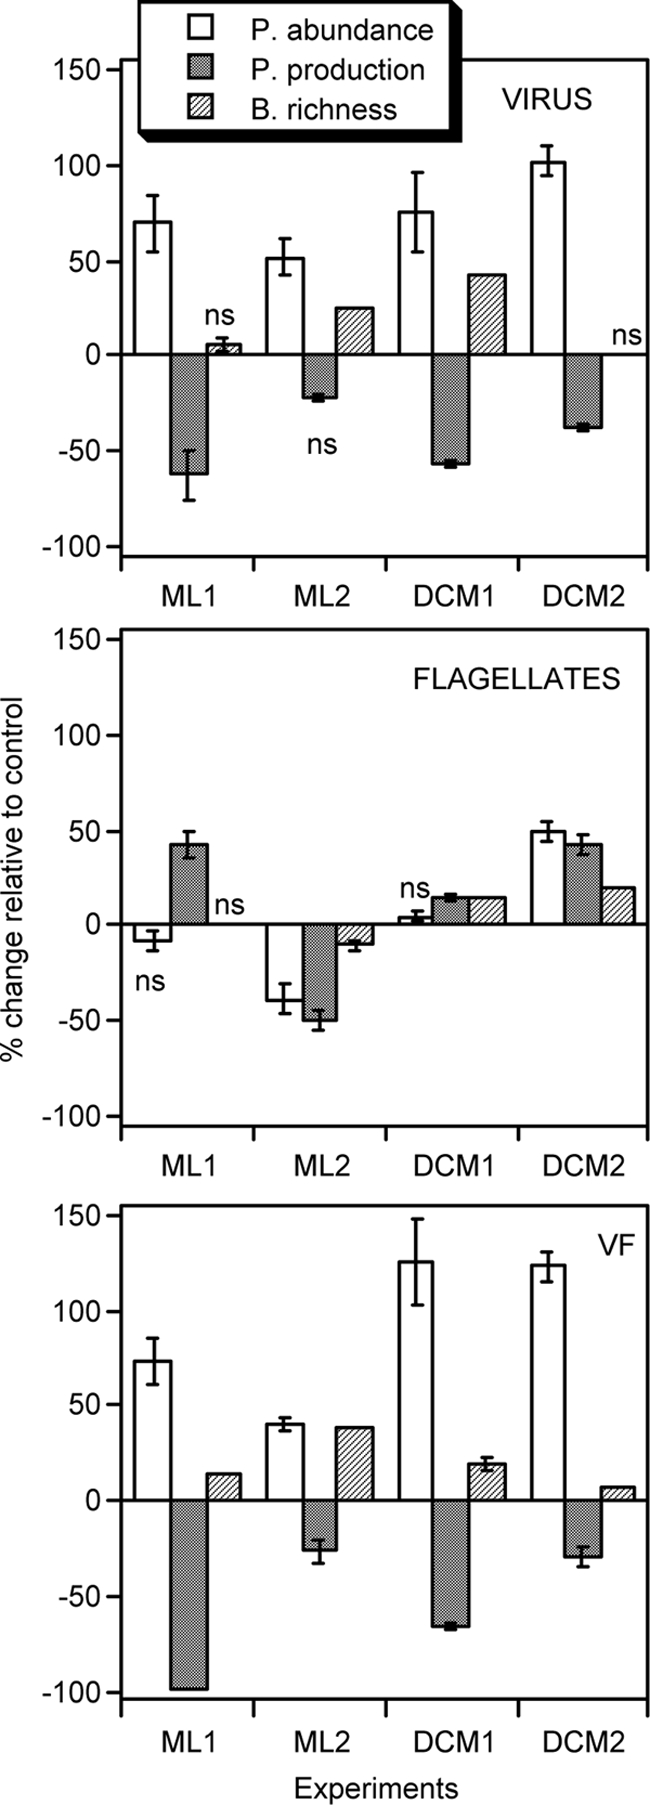
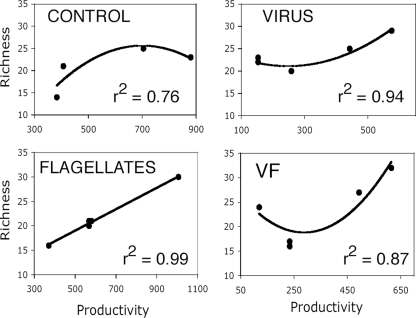
A dilution and size fractionation approach was used to study the separate and combined effects of viruses and flagellates on prokaryotic production ([(3)H]leucine incorporation) and community composition (16S rRNA gene PCR and denaturing gradient gel electrophoresis [DGGE]) in the upper mixed layer and the deep chlorophyll maximum in the offshore Mediterranean Sea. Four experiments were established using differential filtration: a resource control without predators (C treatment), treatment in the presence of viruses (V treatment), treatment in the presence of flagellates (F treatment), and treatment in the presence of both predators (VF treatment). The V and VF treatments increased prokaryotic abundance (1.4- to 2.3-fold) and the number of DGGE bands (by up to 43%) and decreased prokaryotic production compared to the level for the C treatment (by 22 to 99%). For the F treatment, significant differences compared to the level for the C treatment were found as well, but trends were not consistent across experiments. The relative abundances of the high-nucleic-acid subgroups of prokaryotes with high scatter (HNAhs) in flow cytometer settings were lower in the V and VF treatments than in the C and F treatments. These differences were probably due to lysis of very active HNA prokaryotes in the V and VF treatments. Our results indicate that the presence of viruses or viruses plus flagellates sustains prokaryotic diversity and controls prokaryotic production by regulating the proportion of the highly active members of the community. Our data also suggest that lysis and grazing control influences the relationship between bacterial community composition and prokaryotic production.


Figures

FIG. 1.
FIG. 1.
Study area in the Algerian basin (Western Mediterranean Sea) (left) and track of the buoy deployed near the center of an anticyclonic eddy, with the sampling stations indicated by open circles. Mixed-layer (ML1 and ML2) and DCM (DCM1 and DCM2) regions are shown. Map generated via the Online Map Creation server (http://www.aquarius.geomar.de/omc_intro.html).
FIG. 2.
FIG. 2.
Flow chart of the experimental design. For details, see the main text. C, control treatment; V, virus treatment; F, flagellate treatment; VF, virus-plus-flagellate treatment.
FIG. 3.
FIG. 3.
Proportions (as percentages) of prokaryotic nucleic acid subpopulations to total prokaryotic abundances in the different treatments of the experiments. Shown are values from data points per experiment where prokaryotic abundance was highest (same time point for single experiments). Subgroups: LNA, low nucleic acid; HNAls, high nucleic acid and low scatter; HNAhs, high nucleic acid and high scatter. C, control; V, viruses; F, flagellates; VF, viruses plus flagellates.
FIG. 4.
FIG. 4.
Relationship between two prokaryotic nucleic acid subpopulations (LNA and HNAhs) and prokaryotic production during the course of the experiments. Values represent means ± standard deviations of results from triplicate incubations. The less significant regression equation for HNAls is shown in Results.
FIG. 5.
FIG. 5.
Prokaryotic production in the different treatments of the four experiments (ML1, ML2, DCM1, and DCM2). Values are means ± standard deviations of results from triplicate incubations; when not visible, standard deviations fall within symbols. C, control; V, viruses; F, flagellates; VF, viruses plus flagellates.
FIG. 6.
FIG. 6.
Effects of the three predator treatments (viruses, flagellates, and viruses plus flagellates) on prokaryotic abundance and production and number of bacterial bands relative to the levels for the control. Values are given as percent stimulation ± standard deviations for triplicate incubations. When no error bars are visible, the standard deviation for triplicates was zero. Data for prokaryotic abundance and number of bacterial bands were calculated as stimulation or repression compared to the level for the C treatment for tfinal. For prokaryotic production, the strongest difference (tmiddle or tfinal) compared to the level for the C treatment was used for calculation. Except for the bars labeled “ns” (not significant), all the other stimulations were significantly different from the control level at P values of <0.05.
FIG. 7.
FIG. 7.
Relationship between richness and system productivity in the different treatments. Richness is given as numbers of bands and system productivity as prokaryotic production in pmol leucine liter−1 h−1. Linear and nonlinear models were tested, and the one with the highest correlation coefficient was chosen (n = 12 and P < 0.001 for all panels). For the control, y = 0.00009x2 + 0.1249x − 18.105; for viruses, y = 0.00008x2 − 0.038x + 25.863; for flagellates, y = 0.0219x + 8.1118; and for viruses plus flagellates, y = 0.0001x2 − 0.076x + 29.987.

Similar articles

Cited by

References

    1. Alonso-Saez, L., J. Aristegui, J. Pinhassi, L. Gomez-Consarnau, J. M. Gonzalez, D. Vaqué, S. Agusti, and J. M. Gasol. 2007. Bacterial assemblage structure and carbon metabolism along a productivity gradient in the NE Atlantic Ocean. Aquat. Microb. Ecol. 46:43-53.
    1. Amon, R. M. W., and R. Benner. 1994. Rapid cycling of high-molecular-weight dissolved organic matter in the ocean. Nature 369:549-552.
    1. Arrieta, J.-M., M. G. Weinbauer, C. Lute, and G. J. Herndl. 2004. Response of bacterioplankton to iron addition in the Southern Ocean. Limnol. Oceanogr. 49:799-808.
    1. Arrieta, J. M., and G. J. Herndl. 2002. Changes in bacterial β-glucosidase diversity during a coastal phytoplankton bloom. Limnol. Oceanogr. 47:594-599.
    1. Binder, B. 1999. Reconsidering the relationship between virally induced bacterial mortality and frequency of infected cells. Aquat. Microb. Ecol. 18:207-215.

Publication types

LinkOut - more resources