. 2009 Jul;150(3):1434-49.
doi: 10.1104/pp.109.138701. Epub 2009 May 22.

Ripening-regulated susceptibility of tomato fruit to Botrytis cinerea requires NOR but not RIN or ethylene

Affiliations

Ripening-regulated susceptibility of tomato fruit to Botrytis cinerea requires NOR but not RIN or ethylene

Dario Cantu et al. Plant Physiol. 2009 Jul.

Abstract

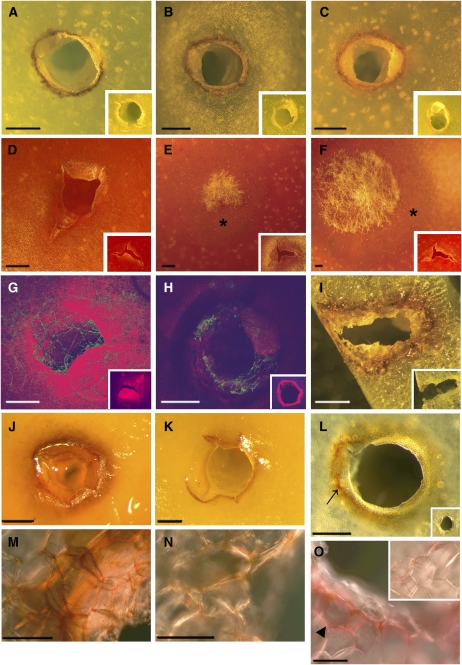
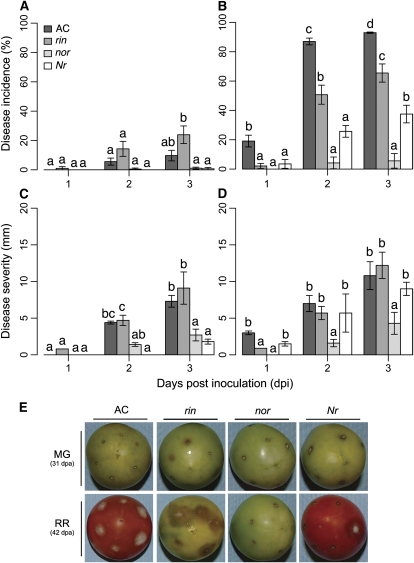
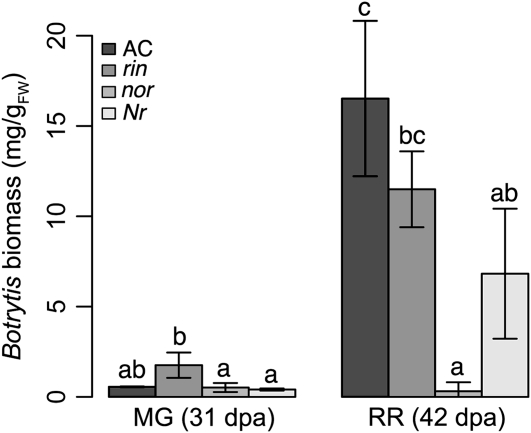
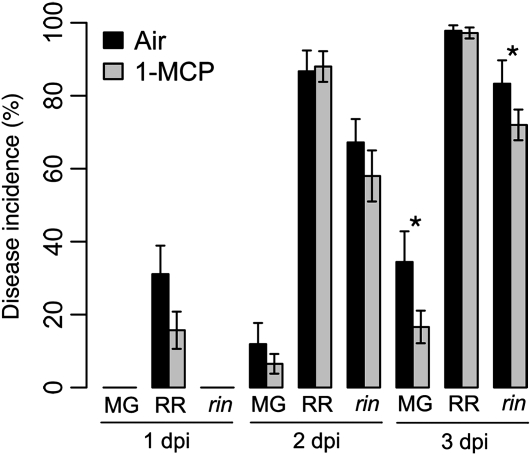
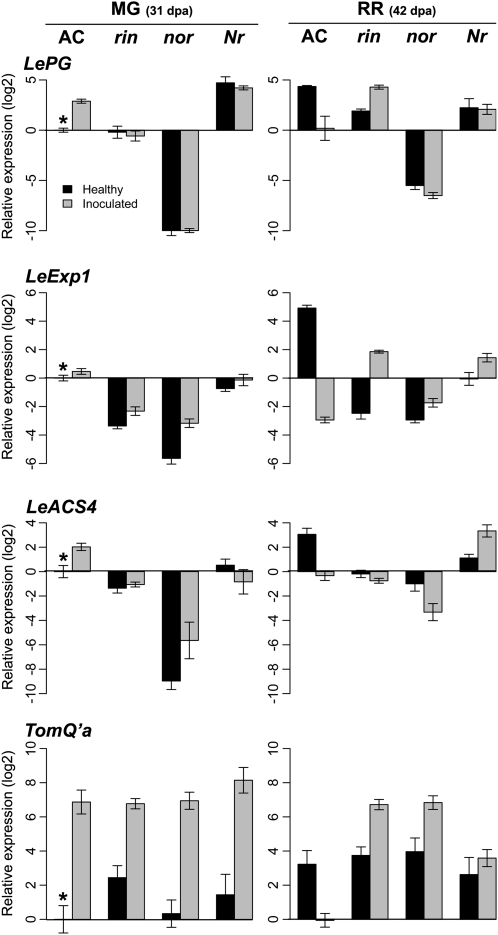
Fruit ripening is a developmental process that is associated with increased susceptibility to the necrotrophic pathogen Botrytis cinerea. Histochemical observations demonstrate that unripe tomato (Solanum lycopersicum) fruit activate pathogen defense responses, but these responses are attenuated in ripe fruit infected by B. cinerea. Tomato fruit ripening is regulated independently and cooperatively by ethylene and transcription factors, including NON-RIPENING (NOR) and RIPENING-INHIBITOR (RIN). Mutations in NOR or RIN or interference with ethylene perception prevent fruit from ripening and, thereby, would be expected to influence susceptibility. We show, however, that the susceptibility of ripe fruit is dependent on NOR but not on RIN and only partially on ethylene perception, leading to the conclusion that not all of the pathways and events that constitute ripening render fruit susceptible. Additionally, on unripe fruit, B. cinerea induces the expression of genes also expressed as uninfected fruit ripen. Among the ripening-associated genes induced by B. cinerea are LePG (for polygalacturonase) and LeExp1 (for expansin), which encode cell wall-modifying proteins and have been shown to facilitate susceptibility. LePG and LeExp1 are induced only in susceptible rin fruit and not in resistant nor fruit. Thus, to infect fruit, B. cinerea relies on some of the processes and events that occur during ripening, and the fungus induces these pathways in unripe fruit, suggesting that the pathogen itself can initiate the induction of susceptibility by exploiting endogenous developmental programs. These results demonstrate the developmental plasticity of plant responses to the fungus and indicate how known regulators of fruit ripening participate in regulating ripening-associated pathogen susceptibility.


Figures

Figure 1.
Figure 1.
B. cinerea on inoculated tomato fruit. A to C, Infection sites on the fruit surface of MG fruit at 1 (A), 2 (B), and 3 (C) dpi. A dark ring of necrosis is visible within 1 dpi. No ring is seen in water-inoculated sites (insets). D to F, Infection sites at 1 (D), 2 (E), and 3 (F) dpi of RR fruit. No necrotic ring is seen, and mycelium growth is slight at 1 dpi but expanding at 2 and 3 dpi. Water-soaked macerated tissue (asterisks) beyond the mycelia is apparent at 2 and 3 dpi. G and H, RR (G) and MG (H) fruit inoculated with B. cinerea B05.10 expressing GFP at 3 dpi. On RR fruit (G), mycelia have spread throughout the pericarp; on MG fruit (H), mycelia spread is limited to the inoculation site surface. I, Transverse section through a MG inoculation site at 3 dpi (as in C) demonstrates that the dark necrotic ring surrounds the entire inoculation wound site. J, K, M, and N, 3,3′-Diaminobenzidine staining of hydrogen peroxide viewed from the surface of the inoculated (J) and wounded (K) fruit demonstrates that within 1 dpi, B. cinerea induces hydrogen peroxide accumulation at the site of inoculation. M and N show micrographs of cross-sections of fruit pericarp tissue surrounding the inoculation (M) and wounding (N) sites. L and O, Phloroglucinol (L) and safranin (O) staining demonstrate that lignin and suberin accumulate in response to B. cinerea (arrow and arrowhead indicate phloroglucinol and safranin reactive material, respectively). Bars in A to L = 0.5 mm; bars in M to O = 0.2 mm. Note that RNA for microarray analyses was collected from MG and RR lesions at 1 dpi (as in A, D, J, M, L, and O). Insets, when present, show a water-inoculated site at the same posttreatment time as the larger image.
Figure 2.
Figure 2.
Susceptibility of tomato ripening mutants to B. cinerea. A and B, Disease incidence (percentage of inoculation sites with soft rot symptoms) of MG fruit (A; 31 dpa) and RR fruit (B; 42 dpa). C and D, Disease severity (e.g. diameters of expanding soft rot lesions) for inoculated MG (C) and RR (D) fruit. Different letters indicate significant differences between genotypes at a given time point (P ≤ 0.01; error bars indicate se; n = 5). E, Representative inoculated fruit (3 dpi) for each genotype and ripening stage.
Figure 3.
Figure 3.
B. cinerea biomass accumulation during infection of tomato ripening mutants. B. cinerea biomass accumulation at 3 dpi in infected MG fruit (31 dpa) and RR fruit (42 dpa) measured using test strips coated with the monoclonal antibody BC12.CA4 (EnviroLogix). Letters correspond to significant differences between genotypes (P ≤ 0.01; error bars indicate sd; n = 3). FW, Fresh weight.
Figure 4.
Figure 4.
Effect of 1-MCP on fruit susceptibility. Disease incidence (percentage of inoculation sites with soft rot symptoms) for MG and RR AC fruit and rin fruit (42 dpa; i.e. RR equivalent). Immediately prior to inoculation and within 2 h of harvest, fruit were treated for 18 h with air or 15 nL L−1 1-MCP. Asterisks indicate significant differences within each fruit stage and at each dpi (P ≤ 0.05; error bars indicate sd; n = 3).
Figure 5.
Figure 5.
Summary of microarray data sets. A, Principal component analysis of RMA-normalized microarray data demonstrates tight clustering of biological replicate data. MGH, MGI, and MGW (MG healthy, inoculated, and wounded fruit) and RRH, RRI, and RRW (RR healthy, inoculated, and wounded fruit) are distinguished by PC1 (78%) and PC2 (9%). B, Bar graphs show the number of probe sets that are either up- or down-regulated in MG and RR fruit when comparisons of expression in wounded or inoculated fruit are made with the healthy controls (ANOVA; adjusted P < 0.01). C, Venn diagrams of the data in B, showing the overlap in probe sets that are up- or down-regulated when inoculated and wounded samples are compared with the healthy control samples.
Figure 6.
Figure 6.
Analysis of probe sets up- and down-regulated by B. cinerea infection. Changes in expression levels (log2) are shown for up-regulated (A and B) and down-regulated (C and D) probe sets hybridizing to RNA from MG (A and C) and RR (B and D) fruit. The (a) sets are the probe sets that are not differentially expressed when healthy (H) and wounded (W) RNA samples are analyzed but are up- or down-regulated when infected (I) samples are compared with either healthy or wounded samples. The (b) sets are the probe sets whose expression is significantly increased when wounded samples are compared with healthy samples and is further significantly increased when infected samples are compared with wounded samples. Each line in the plots represents a specific probe set; the heavy red line represents the median expression change (H versus W versus I). The pie charts below each panel indicate how the expression of the probe sets in each collection was changed by infection at the other ripening stage or by ripening. The left pie chart indicates the percentages of probe sets that were up-regulated (red), down-regulated (green), or not differentially expressed (white) when fruit of the other ripening stage were inoculated. The right pie charts depict the percentages of probe sets of each collection that were up-regulated (black), down-regulated (gray), or not differentially expressed (white) when RNA samples from healthy RR versus healthy MG fruit are compared. The number of probe sets (PN) in each collection is shown above each panel.
Figure 7.
Figure 7.
Correlation between B. cinerea infection or wounding and ripening. A, Scatterplot showing the fold changes (log2) in expression caused by inoculation of MG fruit (MGI/MGH) compared with ripening of healthy MG fruit (RRH/MGH). B, Scatterplot showing the fold changes caused by wounding MG fruit (MGW/MGH) compared with ripening of healthy MG fruit. A 1.5-fold change threshold was applied. A linear trend line and the Pearson correlation coefficient (r2) are displayed. H, Healthy; I, inoculated; W, wounded.
Figure 8.
Figure 8.
Relative expression of selected tomato fruit ripening-related genes, based on microarray analysis. The relative expression of genes regulated by normal fruit ripening is compared with expression in healthy MG fruit (MGH). In each set, the left bar shows the relative change in expression of wounded MG fruit (MGW), the center bar shows the change of infected MG fruit (MGI), and the right bar shows the expression change in healthy RR fruit (RRH). Asterisks indicate significance within the comparison indicated by each bar (adjusted P < 0.01).
Figure 9.
Figure 9.
Relative expression of LePG, LeExp1, LeACS4, and TomQ'a in tomato ripening mutants in response to B. cinerea assessed by qRT-PCR. Gene expression at 3 dpi in infected MG fruit (31 dpa) and RR fruit (42 dpa) was measured using qRT-PCR. Values are relative to the expression of each of the genes in AC MG healthy fruit (asterisks).

References

    1. AbuQamar S, Chen X, Dhawan R, Bluhm B, Salmeron J, Lam S, Dietrich R, Mengiste T (2006) Expression profiling and mutant analysis reveals complex regulatory networks involved in Arabidopsis response to Botrytis infection. Plant J 48 28–44 - PubMed
    1. Agrios GN (2005) Plant Pathology, Ed 5. Elsevier Academic Press, Burlington, MA
    1. Alba R, Payton P, Fei ZJ, McQuinn R, Debbie P, Martin GB, Tanksley SD, Giovannoni JJ (2005) Transcriptome and selected metabolite analyses reveal multiple points of ethylene control during tomato fruit development. Plant Cell 17 2954–2965 - PMC - PubMed
    1. Alexander L, Grierson D (2002) Ethylene biosynthesis and action in tomato: a model for climacteric fruit ripening. J Exp Bot 53 2039–2055 - PubMed
    1. An HJ, Lurie S, Greve LC, Rosenquist D, Kirmiz C, Labavitch JM, Lebrilla CB (2005) Determination of pathogen-related enzyme action by mass spectrometry analysis of pectin breakdown products of plant cell walls. Anal Biochem 338 71–82 - PubMed

Publication types

Associated data