. 2009 Jun;24(3):193-202.
doi: 10.1177/0748730409334748.

A phylogenetically conserved DNA damage response resets the circadian clock

Affiliations

A phylogenetically conserved DNA damage response resets the circadian clock

Joshua J Gamsby et al. J Biol Rhythms. 2009 Jun.

Abstract

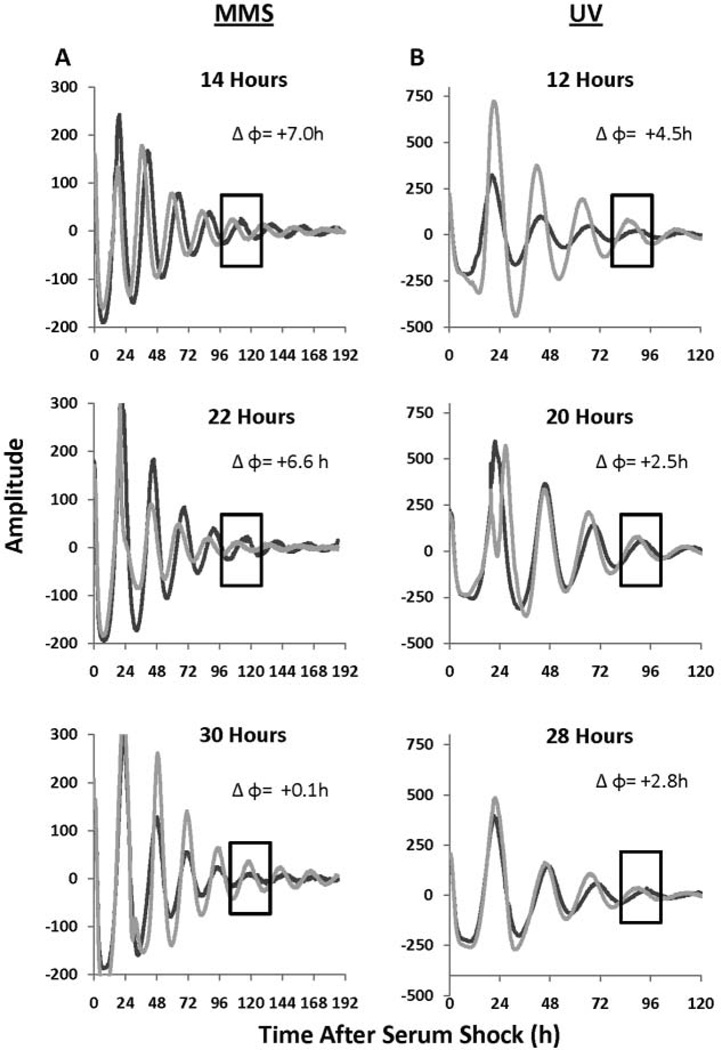
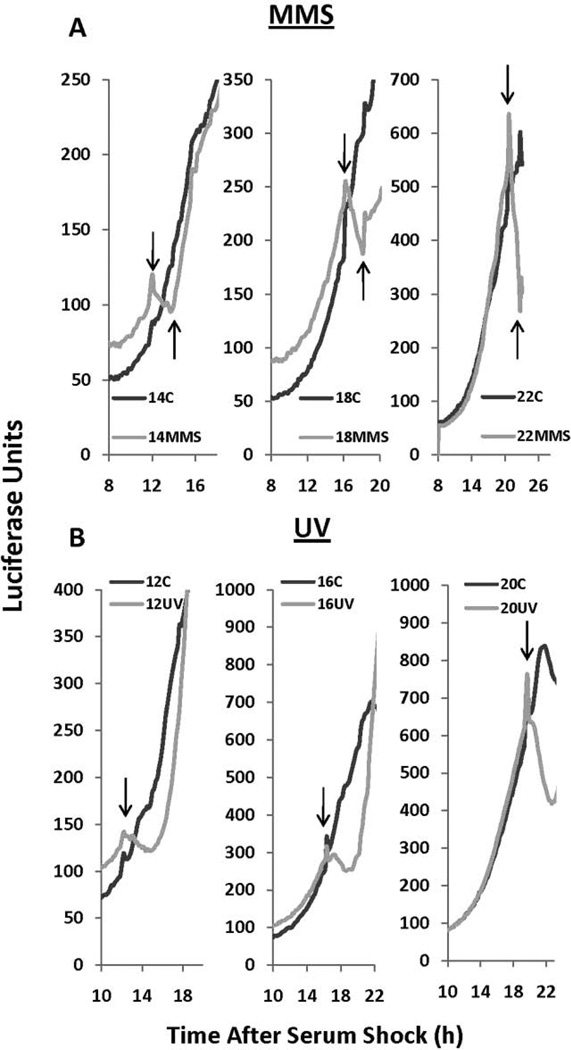
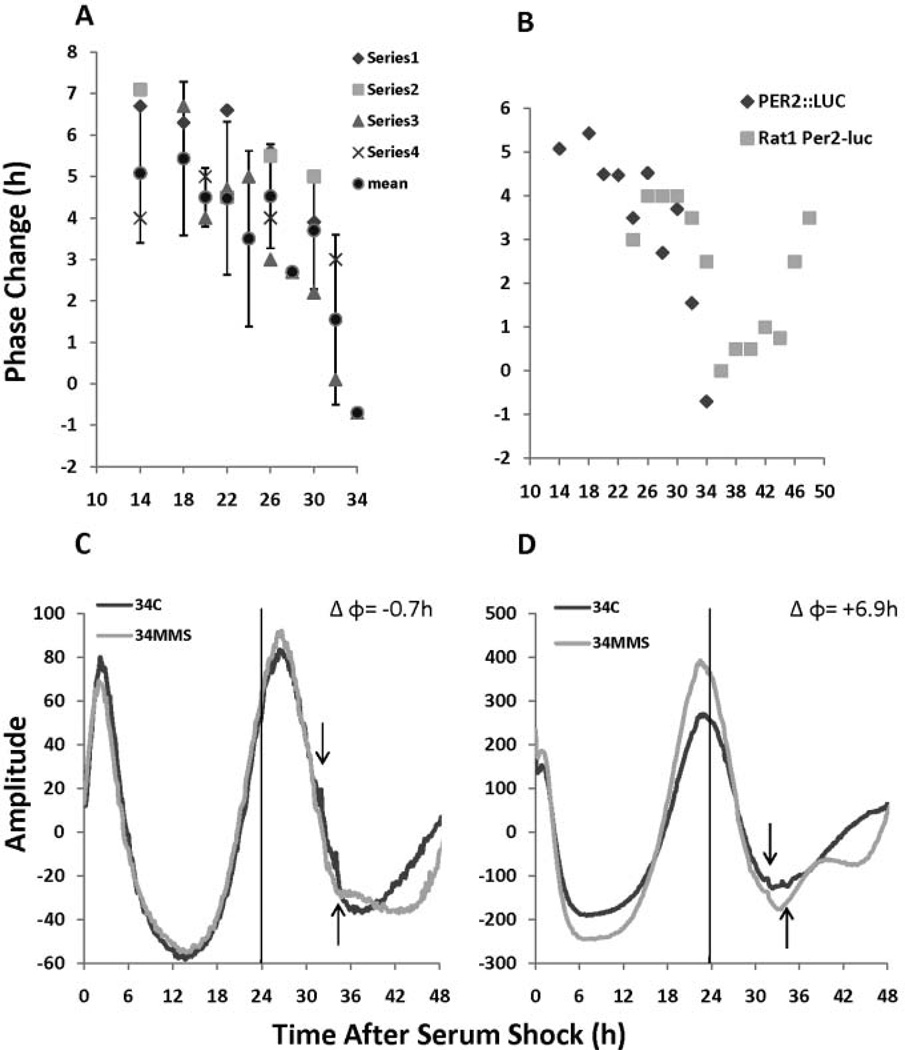
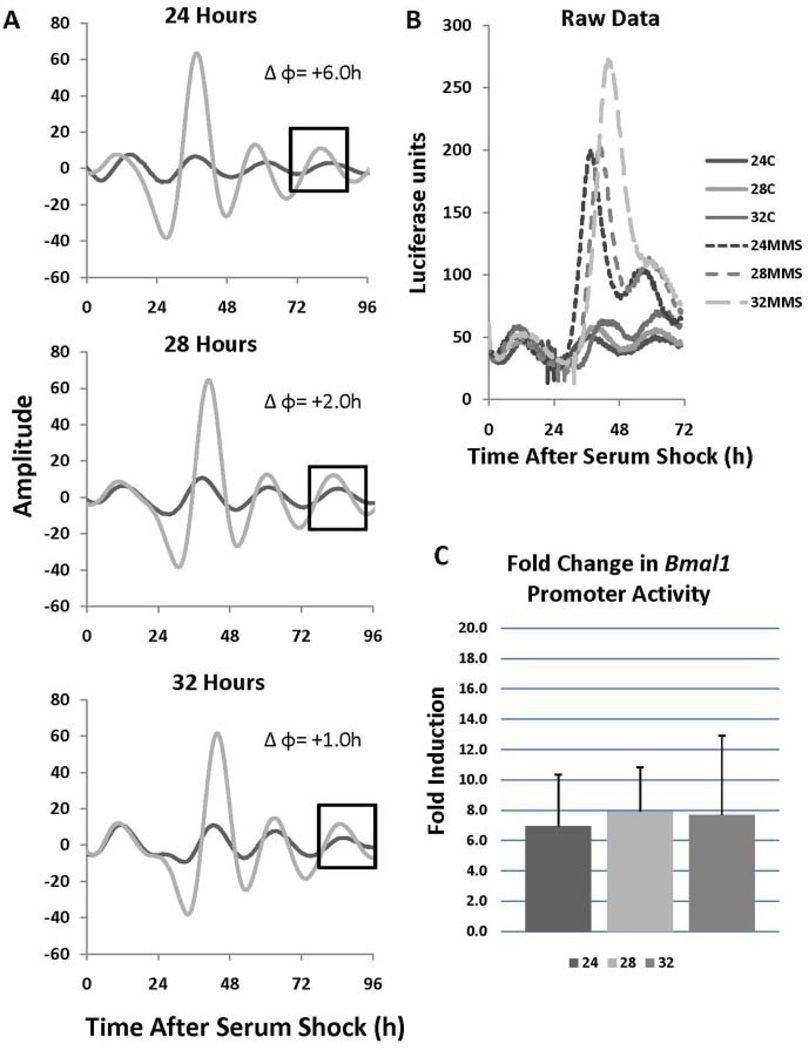
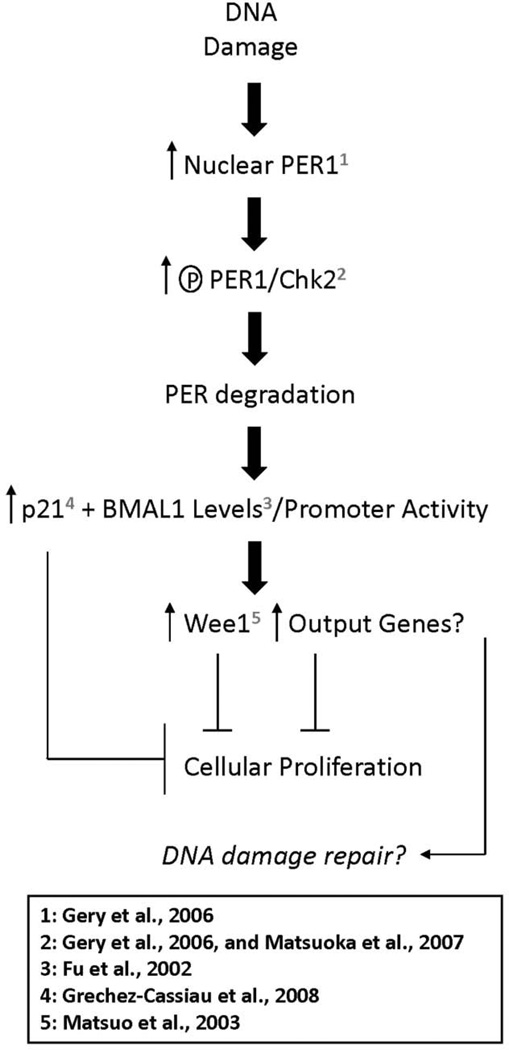
The mammalian circadian clock influences the timing of many biological processes such as the sleep/wake cycle, metabolism, and cell division. Environmental cues such as light exposure can influence the timing of this system through the posttranslational modification of key components of the core molecular oscillator. We have previously shown that DNA damage can reset the circadian clock in a time-of-day-dependent manner in the filamentous fungus Neurospora crassa through the modulation of negative regulator FREQUENCY levels by PRD-4 (homologue of mammalian Chk2). We show that DNA damage, generated with either the radiomimetic drug methyl methane sulfonate or UV irradiation, in mouse embryonic fibroblasts isolated from PER2::LUC transgenic mice or in the NIH3T3 cell line, elicits similar responses. In addition to induction of phase advances, DNA damage caused a decrease in luciferase signal in PER2::LUC mouse embryonic fibroblast cells that is indicative of PER2 degradation. Finally, we show that the activity of the BMAL1 promoter is enhanced during DNA damage. These findings provide further evidence that the DNA damage-mediated response of the clock is conserved from lower eukaryotes to mammals.


Figures

Figure 1
Figure 1
Methyl methane sulfonate (MMS) and UV-mediated DNA damage-induced phase shifts in PER2::LUC mouse embryonic fibroblast (MEF) cells. (A) Treatment with either 1 mM MMS or a vehicle control was performed for 2 h and released at 14, 22, and 30 h after serum shock, and the rhythms were followed for 7 days. DNA damage with 1 mM MMS yielded a phase change (Δφ) of 7.0, 6.6, and 0.1 h, respectively, as is evident by comparing treated cultures and controls in the boxed region. The black line indicates the treatment control and the gray line indicates 1 mM MMS treatment. (B) Treatment with 20 J/m2 of UV at 12, 20, and 28 h after serum shock was performed and the rhythms were followed approximately 5 days. DNA damage with UV yielded a Δφ of 4.5,2.5, and 2.8 h, respectively, as can be seen by comparing treated and control cultures within the boxed region. The black line indicates the mock treatment control and the gray line indicates UV treatment. The data have been smoothed and baseline subtracted to emphasize the rhythms.
Figure 2
Figure 2
Methyl methane sulfonate (MMS) and UV-mediated DNA damage causes an acute decrease in luciferase levels in PER2::LUC cells. (A) An acute decrease in luciferase levels was observed during 1 mM MMS treatment at 14 (left), 18 (middle), and 22 (right) h after serum shock, when PER2::LUC levels are increasing. Onset of MMS treatment is indicated by the downward arrow, and offset of MMS treatment is indicated by the upward arrow. (B) UV treatment (20 J/m) at 12,16, and 20 h after synchronization also causes an acute decrease in PER2::LUC levels. The black line indicates the treatment control and the gray line indicates either MMS (A) or UV (B) treatment. Raw data are replotted with no smoothing or background subtractions so that acute responses can be reported in real time.
Figure 3
Figure 3
DNA damage-induced phase-response curves (PRCs) in PER2::LUC mouse embryonic fibroblast (MEF) cells. (A) A representative PRC in which the phase shift is plotted as a function of when methyl methane sulfonate (MMS) treatment was given; the diamond, square, triangle, and × are the Δφ for each individual experiment, and the circle is the mean ± SD. The mean Δφ and standard deviation are as follows: 14: 5.8 ± 1.6 h, 18: 5.4 ± 1.9 h, 20:4.5 ± 0.7 h, 22: 4.48 ± 1.8 h, 24: 3.5 ± 2.1 h, 26: 4.5 ± 1.25 h, 28: 2.8 h ± N/A, 30: 3.7 ± 1.4 h, 32:1.55 ± 2.05 h, and 34: −0.7 ± N/A. MMS treatment at various points over the first cycle of PER2::LUC expression yields maximum phase advances at phases when PER2::LUC levels are increasing (see text for details). (B) Comparison of published DNA damage-induced PRC data from RAT-1 cells (gray boxes, replotted from Oklejewicz et al., 2008) with PER2::LUC MEF cells (black diamonds). The data points shown represent the mean values from each PRC experiment for each individual time point. (C and D) DNA damage 34 h after serum shock results in a variable phase response, where the magnitude of the phase change is dependent on the phase of PER2 expression. In panel C, PER2 levels are declining during DNA damage, which results in a Δφ of −0.7 h, whereas DNA damage during the beginning of the next cycle of PER2 results in a Δφ of +6.9 h. Raw data with no smoothing or background subtraction are shown.
Figure 4
Figure 4
DNA damage induces BMAL1 promoter activity. (A) NIH3T3 cells were transiently transfected with a mouse BMAL1 promoter construct driving luciferase expression, synchronized via serum shock, treated with 1 mM methyl methane sulfonate (MMS) for 2 h, and released at 24, 28, and 32 h after synchronization. The data were baseline subtracted and smoothed. The black box highlights the cycle where the phase change was calculated. The dark line indicates a treatment control and the gray line indicates MMS treatment. (B) Raw data traces from panel A illustrates MMS treatment induces BMAL1 promoter activity to significantly higher levels than the treatment controls. Induction of BMAL1 promoter activity occurred at all time points tested. (C) Fold induction from panel B, which was calculated from the first peak after MMS treatment; n = 4.
Figure 5
Figure 5
Processes underlying the DNA damage-related clock response. Points and processes addressed and proteins examined in previous studies are numbered as marked. See the text for a more detailed discussion.

References

    1. Balsalobre A, Damiola F, Schibler U. A serum shock induces circadian gene expression in mammalian tissue culture cells. Cell. 1998;93:929–937. - PubMed
    1. Bartek J, Bartkova J, Lukas J. DNA damage signalling guards against activated oncogenes and tumour progression. Oncogene. 2007;26:7773–7779. - PubMed
    1. Chen-Goodspeed M, Lee CC. Tumor suppression and circadian function. J Biol Rhythms. 2007;22:291–298. - PubMed
    1. Dunlap JC. Molecular bases for circadian clocks. Cell. 1999;96:271–290. - PubMed
    1. Ehret CF. Action spectra and nucleic acid metabolism in circadian rhythms at the cellular level. Cold Spring Harb Symp Quant Biol. 1960;25:149–158. - PubMed

Publication types

MeSH terms

LinkOut - more resources