. 2009 Jun;41(6):657-65.
doi: 10.1038/ng.388. Epub 2009 May 24.

Genome-wide and fine-resolution association analysis of malaria in West Africa

Collaborators, Affiliations

Genome-wide and fine-resolution association analysis of malaria in West Africa

Muminatou Jallow et al. Nat Genet. 2009 Jun.

Abstract

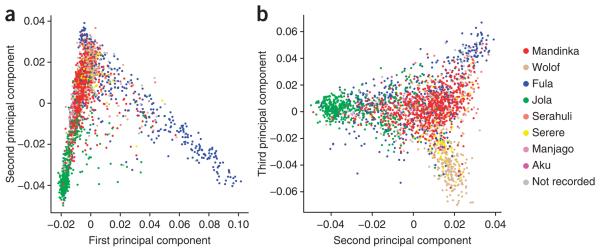
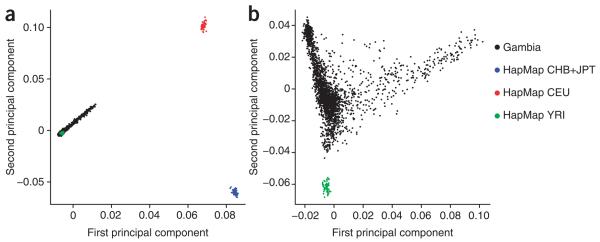
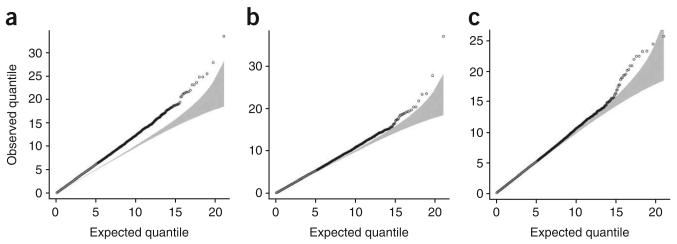
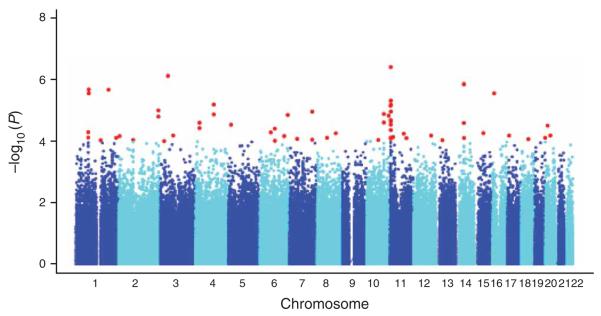
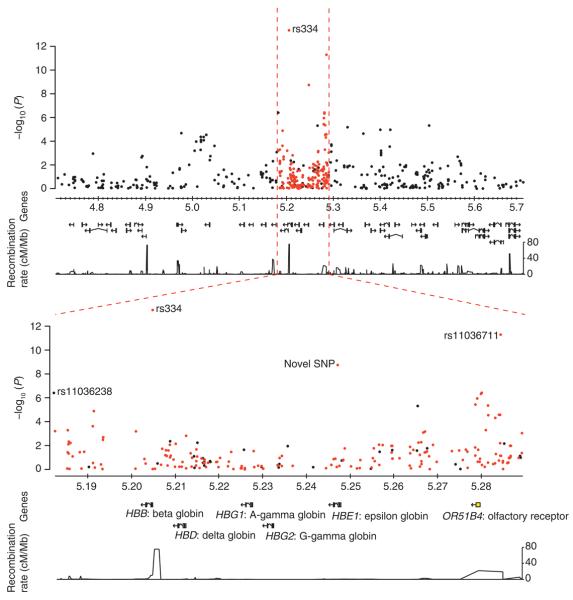
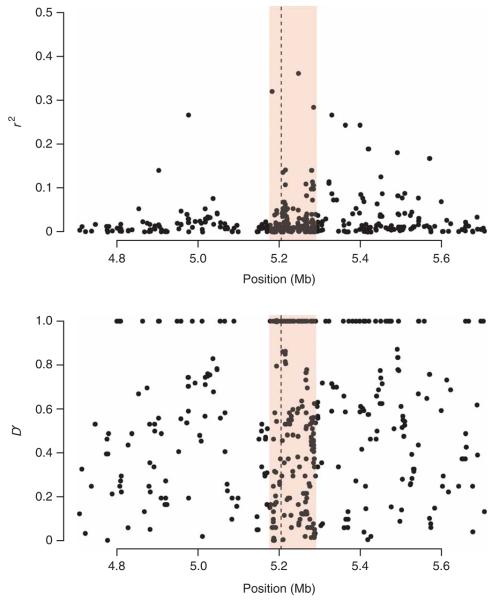
We report a genome-wide association (GWA) study of severe malaria in The Gambia. The initial GWA scan included 2,500 children genotyped on the Affymetrix 500K GeneChip, and a replication study included 3,400 children. We used this to examine the performance of GWA methods in Africa. We found considerable population stratification, and also that signals of association at known malaria resistance loci were greatly attenuated owing to weak linkage disequilibrium (LD). To investigate possible solutions to the problem of low LD, we focused on the HbS locus, sequencing this region of the genome in 62 Gambian individuals and then using these data to conduct multipoint imputation in the GWA samples. This increased the signal of association, from P = 4 × 10(-7) to P = 4 × 10(-14), with the peak of the signal located precisely at the HbS causal variant. Our findings provide proof of principle that fine-resolution multipoint imputation, based on population-specific sequencing data, can substantially boost authentic GWA signals and enable fine mapping of causal variants in African populations.


Figures

Figure 1
Figure 1
Principal components analysis of population structure within The Gambia. Plots of the first three principal components from EIGENSTRAT using 100,715 SNPs selected to minimize intermarker LD. Each solid circle represents an individual, and the color is assigned according to self-reported ethnicity. (a) Plot of the first two principal components for all Gambian samples. (b) Plot of the second and third principal component for all Gambian samples.
Figure 2
Figure 2
Principal components analysis of population structure for the Gambian study sample in relation to HapMap reference panels. Plots of the first two principal components from EIGENSTRAT using 100,715 SNPs selected to minimize intermarker LD. Each solid circle represents an individual. (a) Plot of the first two principal components for HapMap and Gambian samples. (b) Plot of the first two principal components for HapMap YRI and Gambian samples.
Figure 3
Figure 3
Quantile-quantile plots of association test statistic. (a–c) Quantile-quantile plots of the trend test statistic for the unstratified analysis, which uses all 958 cases and 1,382 controls (a); the ethnic-stratified analysis, which tests 854 cases, 1,195 controls from the four major ethnic groups (b); and the PCA analysis, which corrects for the first three principal components from EIGENSTRAT and uses all 958 cases and 1,382 controls (c). The shaded region in gray represents the lower and upper 95% probability bounds for the expected quantiles.
Figure 4
Figure 4
Genome-wide signals of association with severe malaria. Plot of the −log10 P values for the trend test correcting for the first three principal components from EIGENSTRAT. Each point represents a SNP from the 402,814 remaining after quality control filters were applied. Different bands of blue are used to differentiate SNPs on consecutive autosomal chromosomes. SNPs with P values less than 10−4 are represented by red points.
Figure 5
Figure 5
Association signal at the HBB locus. The top panel shows the association signals across a 1-Mb region on chromosome 11 centering on rs334, with the vertical axis representing the −log10 P values from the Armitage trend test. Points in black represent SNPs that are found on the Affymetrix array, and points in red represent SNPs imputed with the resequenced Gambian reference panel. The dashed lines in red indicate the start and end of the sequenced region. The bottom panels focus on the 110-kb sequenced region, together with a map of the recombination rates and genes found in the region. Recombination rates and genes were extracted from the HapMap Genome Browser.
Figure 6
Figure 6
Extent of LD surrounding HbS. Each point show r2 (top panel) and D' (bottom panel) between the HbS SNP (rs334) and SNPs in the Gambian reference panel. The shaded pink region indicates the boundaries of the resequenced region. The dashed vertical line indicates the position of rs334.

Similar articles

  • Imputation-based meta-analysis of severe malaria in three African populations.
    Band G, Le QS, Jostins L, Pirinen M, Kivinen K, Jallow M, Sisay-Joof F, Bojang K, Pinder M, Sirugo G, Conway DJ, Nyirongo V, Kachala D, Molyneux M, Taylor T, Ndila C, Peshu N, Marsh K, Williams TN, Alcock D, Andrews R, Edkins S, Gray E, Hubbart C, Jeffreys A, Rowlands K, Schuldt K, Clark TG, Small KS, Teo YY, Kwiatkowski DP, Rockett KA, Barrett JC, Spencer CC; Malaria Genomic Epidemiology Network. Band G, et al. PLoS Genet. 2013 May;9(5):e1003509. doi: 10.1371/journal.pgen.1003509. Epub 2013 May 23. PLoS Genet. 2013. PMID: 23717212 Free PMC article.
  • Imputation without doing imputation: a new method for the detection of non-genotyped causal variants.
    Howey R, Cordell HJ. Howey R, et al. Genet Epidemiol. 2014 Apr;38(3):173-90. doi: 10.1002/gepi.21792. Epub 2014 Feb 17. Genet Epidemiol. 2014. PMID: 24535679 Free PMC article.
  • Malaria protection due to sickle haemoglobin depends on parasite genotype.
    Band G, Leffler EM, Jallow M, Sisay-Joof F, Ndila CM, Macharia AW, Hubbart C, Jeffreys AE, Rowlands K, Nguyen T, Gonçalves S, Ariani CV, Stalker J, Pearson RD, Amato R, Drury E, Sirugo G, d'Alessandro U, Bojang KA, Marsh K, Peshu N, Saelens JW, Diakité M, Taylor SM, Conway DJ, Williams TN, Rockett KA, Kwiatkowski DP. Band G, et al. Nature. 2022 Feb;602(7895):106-111. doi: 10.1038/s41586-021-04288-3. Epub 2021 Dec 9. Nature. 2022. PMID: 34883497 Free PMC article.
  • Methodological challenges of genome-wide association analysis in Africa.
    Teo YY, Small KS, Kwiatkowski DP. Teo YY, et al. Nat Rev Genet. 2010 Feb;11(2):149-60. doi: 10.1038/nrg2731. Nat Rev Genet. 2010. PMID: 20084087 Free PMC article. Review.
  • QTL mapping using high-throughput sequencing.
    Jamann TM, Balint-Kurti PJ, Holland JB. Jamann TM, et al. Methods Mol Biol. 2015;1284:257-85. doi: 10.1007/978-1-4939-2444-8_13. Methods Mol Biol. 2015. PMID: 25757777 Review.

Cited by

References

    1. Snow RW, Guerra CA, Noor AM, Myint HY, Hay SI. The global distribution of clinical episodes of Plasmodium falciparum malaria. Nature. 2005;434:214–217. - PMC - PubMed
    1. Greenwood BM, et al. Mortality and morbidity from malaria among children in a rural area of The Gambia, West Africa. Trans. R. Soc. Trop. Med. Hyg. 1987;81:478–486. - PubMed
    1. Mackinnon MJ, Mwangi TW, Snow RW, Marsh K, Williams TN. Heritability of Malaria in Africa. PLoS Med. 2005;2:e340. - PMC - PubMed
    1. Malaria Genomic Epidemiology Network A global network for investigating the genomic epidemiology of malaria. Nature. 2008;456:732–737. - PMC - PubMed
    1. International HapMap Consortium A haplotype map of the human genome. Nature. 2005;437:1299–1320. - PMC - PubMed

Publication types

Substances