

Comparison of different signal thresholds on data dependent sampling in Orbitrap and LTQ mass spectrometry for the identification of peptides and proteins in complex mixtures
- PMID: 19467883
- PMCID: PMC2946190
- DOI: 10.1016/j.jasms.2009.04.007
Comparison of different signal thresholds on data dependent sampling in Orbitrap and LTQ mass spectrometry for the identification of peptides and proteins in complex mixtures
Abstract
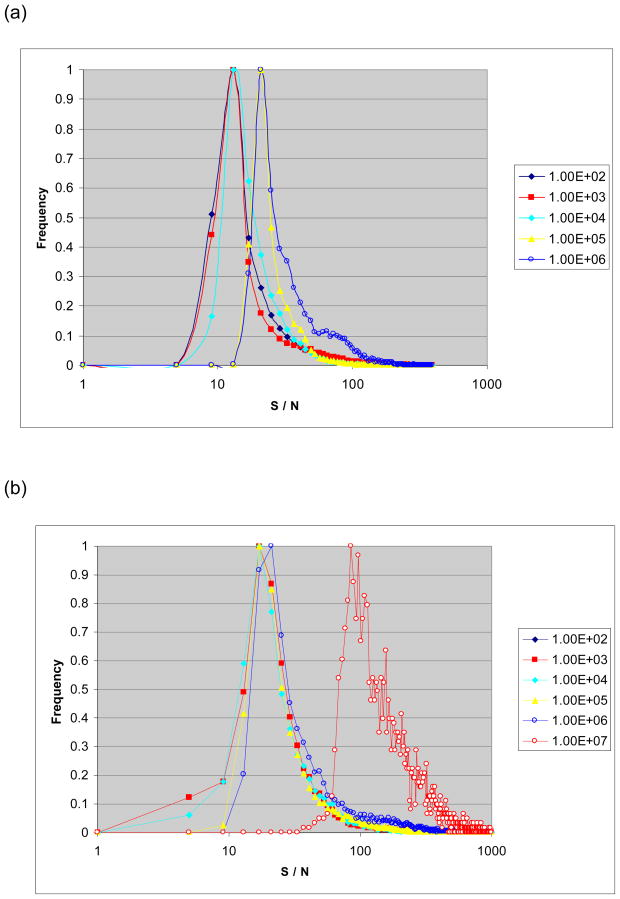
We evaluate the effect of ion-abundance threshold settings for data-dependent acquisition on a hybrid LTQ-Orbitrap mass spectrometer, analyzing features such as the total number of spectra collected, the signal to noise ratio of the full MS scans, the spectral quality of the tandem mass spectra acquired, and the number of peptides and proteins identified from a complex mixture. We find that increasing the threshold for data-dependent acquisition generally decreases the quantity but increases the quality of the spectra acquired. This is especially true when the threshold setting is set above the noise level of the full MS scan. We compare two distinct experimental configurations: one where full MS scans are acquired in the Orbitrap analyzer while tandem MS scans are acquired in the LTQ analyzer, and one where both full MS and tandem MS scans are acquired in the LTQ analyzer. We examine the number of spectra, peptides, and proteins identified under various threshold conditions, and we find that the optimal threshold setting is at or below the respective noise level of the instrument regardless of whether the full MS scan is performed in the Orbitrap or in the LTQ analyzer. When comparing the high-throughput identification performance of the two analyzers, we conclude that, used at optimal threshold levels, the LTQ and the Orbitrap identify similar numbers of peptides and proteins. The higher scan speed of the LTQ, which results in more spectra being collected, is roughly compensated by the higher mass accuracy of the Orbitrap, which results in improved database searching and peptide validation software performance.
Figures


References
-
- Link AJ, Eng J, Schieltz DM, Carmack E, Mize GJ, Morris DR, Garvik BM, Yates JR., III Direct Analysis of Protein Complexes Using Mass Spectrometry. Nat Biotechnol. 1999;17:676–682. - PubMed
-
- Eng J, McCormack A, Yates JR., III An Approach to Correlate MS/MS Data to Amino Acid Sequences in a Protein Database. J Am Soc Mass Spectrom. 1994;5:976–989. - PubMed
-
- Stahl DC, Swiderek KM, Davis MT, Lee TD. Data-Controlled Automation of Liquid Chromatography/Tandem Mass Spectrometry Analysis of Peptide Mixtures. J Am Soc Mass Spectrom. 1996;7:523–540. - PubMed
-
- Wenner BR, Lynn BC. Factors That Affect Ion Trap Data-Dependent MS/MS in Proteomics. J Am Soc Mass Spectrom. 2004;15:150–157. - PubMed
-
- Mann M, Meng CK, Fenn Interpreting Mass Spectra of Multiply Charge Ions. J. B. Anal Chem. 1989;61:1702–1708.
Publication types
MeSH terms
Substances
Grants and funding
LinkOut - more resources
Full Text Sources
Other Literature Sources
