. 2009 Jun 1;185(5):859-74.
doi: 10.1083/jcb.200812167. Epub 2009 May 25.

Mitotic control of kinetochore-associated dynein and spindle orientation by human Spindly

Affiliations

Mitotic control of kinetochore-associated dynein and spindle orientation by human Spindly

Ying Wai Chan et al. J Cell Biol. .

Abstract

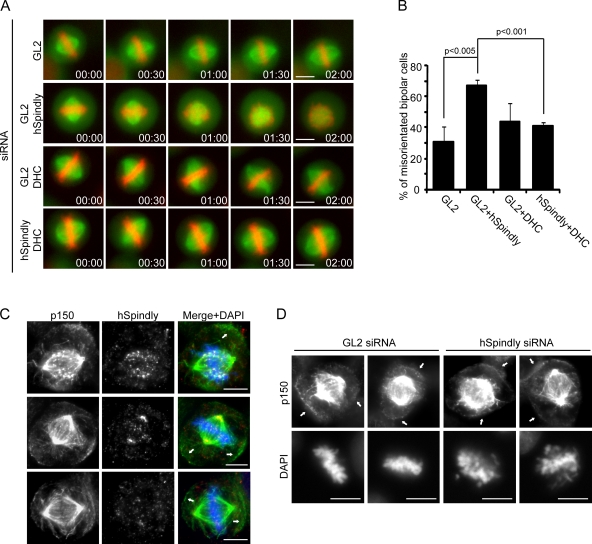
Mitotic spindle formation and chromosome segregation depend critically on kinetochore-microtubule (KT-MT) interactions. A new protein, termed Spindly in Drosophila and SPDL-1 in C. elegans, was recently shown to regulate KT localization of dynein, but depletion phenotypes revealed striking differences, suggesting evolutionarily diverse roles of mitotic dynein. By characterizing the function of Spindly in human cells, we identify specific functions for KT dynein. We show that localization of human Spindly (hSpindly) to KTs is controlled by the Rod/Zw10/Zwilch (RZZ) complex and Aurora B. hSpindly depletion results in reduced inter-KT tension, unstable KT fibers, an extensive prometaphase delay, and severe chromosome misalignment. Moreover, depletion of hSpindly induces a striking spindle rotation, which can be rescued by co-depletion of dynein. However, in contrast to Drosophila, hSpindly depletion does not abolish the removal of MAD2 and ZW10 from KTs. Collectively, our data reveal hSpindly-mediated dynein functions and highlight a critical role of KT dynein in spindle orientation.


Figures

Figure 1.
Figure 1.
hSpindly localizes at outer KTs and spindle poles, downstream of the RZZ and Ndc80 complexes. (A) HeLa S3 cells in interphase were stained with anti-hSpindly (red) and anti–α-tubulin antibodies (green), and DAPI (blue). (B) Cells at different mitotic stages were stained with anti-hSpindly antibody (red), CREST serum or α-tubulin antibody (green), and DAPI (blue). (C) Prometaphase cell stained with anti-hSpindly (red) and anti-BubR1 (green) antibodies and CREST serum (blue). The inset shows a magnification of the selected area (bar, 1 µm). (D) Cells treated for 72 h with GL2 (control) or two independent siRNAs targeting ZW10 (ZW10-1 or ZW10-2 siRNA) were stained with anti-hSpindly antibody (red), CREST serum (green), and DAPI (blue). (E) Western blotting of mitotic (nocodazole shake-off) cells treated for 72 h with GL2 (control), ZW10-1, or ZW10-2 siRNAs. Membranes were probed for the indicated antibodies and α-tubulin is shown as loading control. (F) Cells treated with GL2 (control) or Hec1 siRNAs for 48 h were stained with anti-Hec1 (green) and anti-hSpindly (red) antibodies, and DAPI (blue). (G) Western blotting of mitotic (nocodazole shake-off) cells treated with GL2 (control), or Hec1 siRNAs for 40 h. Membranes were probed for the indicated antibodies and α-tubulin is shown as loading control. Bars, 10 µm.
Figure 2.
Figure 2.
Aurora B regulates the localization of hSpindly in response to taxol. (A) HeLa S3 cells were treated with GL2 (control) or Aurora B siRNAs for 40 h, or with ZM447439 (ZM) for 16 h before being stained with anti-hSpindly (red) and anti–α-tubulin (green) antibodies and DAPI (blue). (B) Cells were treated with GL2 (control) or Aurora B siRNAs for 40 h. DMSO (control) or ZM447439 (ZM) was added to GL2-treated cells for the last 16 h. Mitotic cells (nocodazole shake-off) were collected and equal amounts of cell extracts were separated by SDS-PAGE and probed by Western blotting with the indicated antibodies; α-tubulin is shown as loading control. (C) Cells were treated with MG132 for 2 h. During the second hour, taxol was added. Cells were then stained with anti-hSpindly (red) and anti-BubR1 (green) antibodies and CREST serum (blue). (D) Graph showing the numbers of KTs from 10 cells treated as in C (399 KTs in total) that were positive for BubR1 (left circle) or hSpindly (right circle). The overlapping region represents the number of KTs that were positive for both BubR1 and hSpindly. Percentages of KTs positive for BubR1 or hSpindly are shown. (E) Graph showing the percentages of sister KT pairs with both KTs positive (+/+), only one sister KT positive (+/−), or both negative (−/−) for BubR1 and hSpindly, respectively (>90 sister KT pairs from 10 cells were counted). (F) Cells were treated with MG132 for 2 h. During the second hour, DMSO, nocodazole (Noc), or taxol with or without ZM447439 (ZM) was added. Cells were then stained with anti-hSpindly (red) and anti-MAD2 (green) antibodies and CREST serum (blue). (G) Cells were synchronized by sequential thymidine arrest (overnight) and release (9 h) before being treated as in F. Mitotic cells were collected by shake-off. Equal amounts of cell extracts were separated by SDS-PAGE and probed by Western blotting with the indicated antibodies; α-tubulin is shown as loading control. (H) Bar graph showing the quantification of hSpindly and MAD2 staining intensities at KTs (normalized against CREST) of cells in F (20 KTs were counted per cell and error bars indicate the standard deviation [SD] of measurements from 8 cells). Bars, 10 µm.
Figure 3.
Figure 3.
Depletion of hSpindly induces chromosome misalignment and mitotic delay. (A) Mitotic indices were determined for HeLa S3 cells after treatment for 48 h with GL2 (control) or two independent siRNAs targeting hSpindly (hSpindly-1 and hSpindly-2). Bar graphs show the results of three independent experiments (>100 cells each) and error bars indicate SD. The bottom panel shows Western blotting of cells treated for the indicated times with the above-mentioned siRNAs. Membranes were probed with anti-hSpindly antibody and α-tubulin is shown as loading control. (B) Cells treated with GL2 or hSpindly-2 siRNA for 48 h were stained with anti-hSpindly and anti–α-tubulin antibodies (green), and CREST serum (red) and DAPI (blue). (C) Cells were treated with GL2, hSpindly-1, or hSpindly-2 siRNAs for 48 h (and treated with or without MG132 for 2 h) and the percentage of mitotic cells with all chromosomes aligned was determined. Bar graphs represent the results of three independent experiments (>100 cells each, only prometaphase and metaphase cells were counted) and error bars indicate SD. (D) Representative stills from videos of H2B-GFP expressing HeLa S3 cells treated with GL2, hSpindly-2, and ZW10 siRNAs for 48 h before filming. Time is shown in h:min. t = 0 was defined as the time point one frame before chromosome condensation became evident. (E) Box-and-whisker plot showing the time cells spent in mitosis from nuclear envelope breakdown (NEBD) to anaphase after treatment with GL2 (control), hSpindly-1 and hSpindly-2 siRNA (3 experiments, >80 cells per experiment, P < 0.0001), or ZW10 siRNAs (2 experiments, >80 cells per experiment, P < 0.0001). Bars, 10 µm.
Figure 4.
Figure 4.
hSpindly targets both dynein and dynactin to KTs. (A) HeLa S3 cells were treated with GL2 or hSpindly siRNAs for 48 h. Nocodazole was added to the cells 2 h before they were stained with CREST serum (green), anti-p150Glued antibody (red), and DNA (blue). (B) Cells treated as in A were stained with CREST serum (green) and anti-dynein intermediate chain (DIC) antibody (red) and DNA (blue). (C) Cells were treated with GL2, hSpindly-1, or hSpindly-2 siRNAs for 48 h. Lysates from mitotic cells (nocodazole shake-off) were prepared and equal amounts of cell extracts were separated by SDS-PAGE and probed by Western blotting with the indicated antibodies. (D) Cells were transfected with hSpindly-2 siRNA together with either a myc-vector construct (V) or a myc-tagged hSpindly (siRNA-resistant) construct (WT) for 48 h. Cells were stained with anti-myc, anti-p150Glued antibodies (red), CREST serum (green), and DAPI (blue). (E) Cells were treated as in D. Lysates were prepared and equal amounts of cell extracts were separated by SDS-PAGE and probed by Western blotting with the indicated antibodies. (F) Table showing positive/negative localization of the indicated KT/centromere proteins after hSpindly depletion for 48 h (−, lost from KT; +, indistinguishable from control). For DIC and p150, experiments were repeated with treatment of nocodazole (2 h) to confirm their dependency on hSpindly. Bars, 10 µm.
Figure 5.
Figure 5.
hSpindly is dispensable for removal of MAD2 and ZW10 from KTs. HeLa S3 cells were treated with GL2 or hSpindly siRNAs for 48 h and stained with anti-hSpindly (red) and anti-MAD2 antibodies (green) (A) or anti-hSpindly, anti-MAD2 antibodies (red) and CREST serum (green) (B), and DAPI (blue). (C) Cells were treated with GL2 or hSpindly siRNAs for 48 h and stained with anti-ZW10 (green) or anti-MAD2 (red) antibodies, and DAPI (blue). (D) Cells were transfected with either a myc-vector construct or a myc-tagged p50-dynamitin construct for 48 h and treated with MG132 for 1 h. Cells are then stained with anti-myc 9E10 serum, anti-hSpindly (red) and anti–α-tubulin antibodies (green), and DAPI (blue). Bars, 10 µm.
Figure 6.
Figure 6.
Efficient removal of checkpoint proteins from KTs requires dynein/dynactin. (A) HeLa S3 cells were treated as in Fig. 5 D but stained with anti-MAD2 antibody instead of anti-hSpindly antibody. (B) The percentage of metaphase cells treated as in A with MAD2-positive KT(s) was determined. Bar graph showing the results of three independent experiments (>30 cells each), with error bars indicating SD. (C) To perform an ATP reduction assay, cells were rinsed once with isotonic salt solution and then incubated with either isotonic salt solution with glucose or with sodium azide (Az) and 2-deoxyglucose (DOG). Cells were stained with anti-MAD2 antibody and CREST serum (top), anti-ZW10 and anti-Hec1 antibodies (middle), and anti-hSpindly and anti-Hec1 antibodies (bottom). All cells were simultaneously stained also with anti–α-tubulin antibody and DAPI (blue). (D) Cells were treated as in C, except that 3.3 µM nocodazole was added to the isotonic salt solution. Bars, 10 µm.
Figure 7.
Figure 7.
K-fiber stability after hSpindly depletion. HeLa S3 cells were treated with GL2, hSpindly, or Hec1 siRNAs for 48 h and left at 37°C (A) or placed at 4°C (B) for 20 min, before they were stained with anti–α-tubulin antibody (green), CREST serum (red), and DAPI (blue). Bars, 10 µm.
Figure 8.
Figure 8.
Spindle misorientation and increased spindle length after hSpindly depletion. (A) HeLa S3 cells were treated with GL2 and hSpindly siRNAs for 48 h and stained with anti-hSpindly, anti–centrin-3 (green), and anti–α-tubulin (red) antibodies, and DNA (blue). Panels on the right show four representative sections along the z-axis (section numbers are indicated); z-stacks were taken every 0.2 µm. (B) Cells were seeded onto fibronectin-coated coverslips, treated with the indicated siRNAs for 48 h, and synchronized by a thymidine block (overnight) and release (9 h). MG132 was added to the cells 1 h before they were stained with anti-pericentrin (red) and anti–α-tubulin antibodies (green), and DAPI (blue). Bottom panels show the X-Z projection of the pericentrin signal. (C) Box-and-whisker plot showing the spindle angles (α) of cells treated as in B, calculated by measuring the pole-to-pole distance (x) and the vertical distance (z) between two poles after taking Z-stacks every 0.4 µm (illustrated in top panel). Only cells with well-separated spindle poles (x > 7 µm) were counted (>50 cells) (GL2 vs. hSpindly/ZW10/Nde1, P < 0.0002; GL2 vs. CenpE, P > 0.05). (D) Bar graph showing the pole-to-pole distances (x) of the cells in B. Error bars show the SD after measuring distances from >50 cells. Bars, 10 µm.
Figure 9.
Figure 9.
Spindle misorientation induced by hSpindly depletion depends on dynein. (A) Representative stills from videos of GFP-α-tubulin/cherry-H2B expressing HeLa Kyoto cells treated with the indicated combinations of siRNAs for 54 h and synchronized by double thymidine block and release. 9 h after the second release, MG132 was added for 1 h before filming. Time is shown in h:min. t = 0 was defined as the time point where chromosomes aligned in the metaphase plate. (B) Bar graphs showing the percentages of cells with spindle rotation defects. Error bars show the SD from three experiments (>15 cells per experiment). (C) Cells stained with anti-p150Glued (green) and anti-hSpindy antibodies (red), and DAPI (blue). Arrows indicate p150Glued cortical staining. (D) Cells were treated with GL2 or hSpindly siRNAs for 48 h and stained with anti-p150Glued antibody and DAPI. Arrows indicate p150Glued cortical staining. Bars, 10 µm.

References

    1. Basto R., Gomes R., Karess R.E. 2000. Rough deal and Zw10 are required for the metaphase checkpoint in Drosophila.Nat. Cell Biol. 2:939–943 - PubMed
    1. Basto R., Scaerou F., Mische S., Wojcik E., Lefebvre C., Gomes R., Hays T., Karess R. 2004. In vivo dynamics of the rough deal checkpoint protein during Drosophila mitosis.Curr. Biol. 14:56–61 - PubMed
    1. Buffin E., Lefebvre C., Huang J., Gagou M.E., Karess R.E. 2005. Recruitment of Mad2 to the kinetochore requires the Rod/Zw10 complex.Curr. Biol. 15:856–861 - PubMed
    1. Busson S., Dujardin D., Moreau A., Dompierre J., De Mey J.R. 1998. Dynein and dynactin are localized to astral microtubules and at cortical sites in mitotic epithelial cells.Curr. Biol. 8:541–544 - PubMed
    1. Chan G.K., Jablonski S.A., Starr D.A., Goldberg M.L., Yen T.J. 2000. Human Zw10 and ROD are mitotic checkpoint proteins that bind to kinetochores.Nat. Cell Biol. 2:944–947 - PubMed

Publication types