. 2009 Jun;133(6):603-22.
doi: 10.1085/jgp.200810169.

CO2-induced ion and fluid transport in human retinal pigment epithelium

Affiliations

CO2-induced ion and fluid transport in human retinal pigment epithelium

Jeffrey Adijanto et al. J Gen Physiol. 2009 Jun.

Abstract

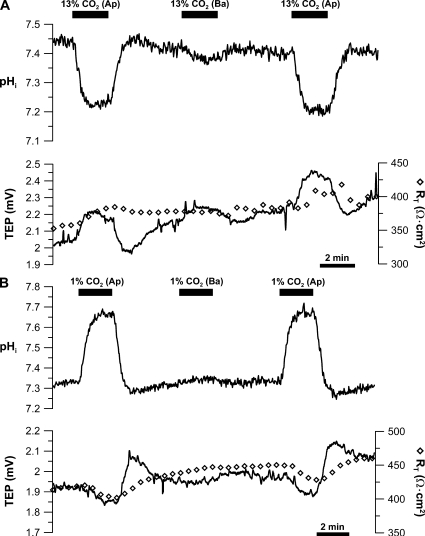
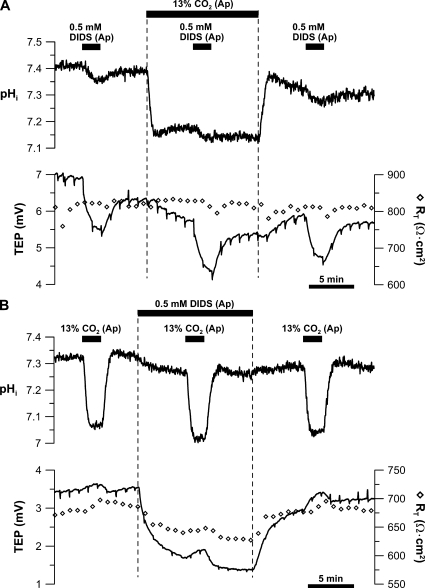
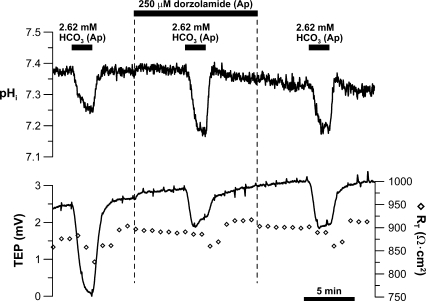
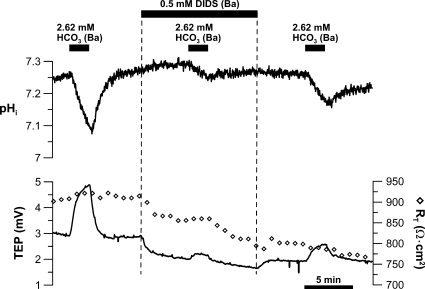
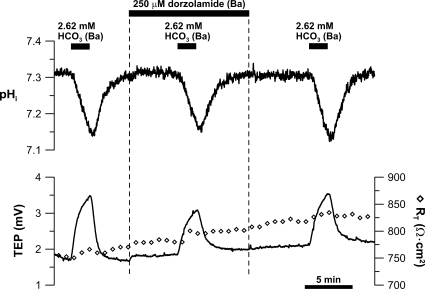
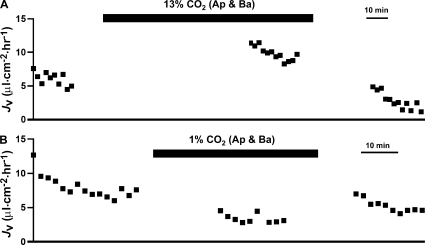
In the intact eye, the transition from light to dark alters pH, [Ca2+], and [K] in the subretinal space (SRS) separating the photoreceptor outer segments and the apical membrane of the retinal pigment epithelium (RPE). In addition to these changes, oxygen consumption in the retina increases with a concomitant release of CO2 and H2O into the SRS. The RPE maintains SRS pH and volume homeostasis by transporting these metabolic byproducts to the choroidal blood supply. In vitro, we mimicked the transition from light to dark by increasing apical bath CO2 from 5 to 13%; this maneuver decreased cell pH from 7.37 +/- 0.05 to 7.14 +/- 0.06 (n = 13). Our analysis of native and cultured fetal human RPE shows that the apical membrane is significantly more permeable (approximately 10-fold; n = 7) to CO2 than the basolateral membrane, perhaps due to its larger exposed surface area. The limited CO2 diffusion at the basolateral membrane promotes carbonic anhydrase-mediated HCO3 transport by a basolateral membrane Na/nHCO3 cotransporter. The activity of this transporter was increased by elevating apical bath CO2 and was reduced by dorzolamide. Increasing apical bath CO2 also increased intracellular Na from 15.7 +/- 3.3 to 24.0 +/- 5.3 mM (n = 6; P < 0.05) by increasing apical membrane Na uptake. The CO2-induced acidification also inhibited the basolateral membrane Cl/HCO3 exchanger and increased net steady-state fluid absorption from 2.8 +/- 1.6 to 6.7 +/- 2.3 microl x cm(-2) x hr(-1) (n = 5; P < 0.05). The present experiments show how the RPE can accommodate the increased retinal production of CO2 and H(2)O in the dark, thus preventing acidosis in the SRS. This homeostatic process would preserve the close anatomical relationship between photoreceptor outer segments and RPE in the dark and light, thus protecting the health of the photoreceptors.


Figures

Figure 1.
Figure 1.
13% apical CO2 increases net solute and fluid absorption across the RPE. The transporters and channels depicted in this model are adopted from earlier studies of frog, bovine, human, and cultured human RPE. Apical membrane proteins: Na/K ATPase, Na/K/2Cl cotransporter (NKCC1), Na/H exchanger (NHE), and Na/2HCO3 cotransporter (NBC1). Basolateral membrane proteins: Ca2+-activated Cl channels, cAMP-sensitive CFTR, Cl/HCO3 exchanger (AE2), and Na/nHCO3 cotransporter (NBC). Increasing apical CO2 increases Na (Cl + HCO3) and fluid absorption from the SRS to the choroid.
Figure 2.
Figure 2.
CO2 flux across the apical and basolateral membranes. (A) 13% CO2-equilibrated Ringer was perfused into the apical or basal bath. (B) 1% equilibrated Ringer was perfused into the apical or basal bath. The solid bars above the graph represent the beginning and end of a solution change (from control Ringer). The alteration in Ringer composition or the addition of drugs is indicated on the label above the solid bars. The time bar applies to pHi, TEP, and RT measurements and is located under the TEP/RT panels. In each experiment, pHi, TEP, and RT were measured simultaneously.
Figure 3.
Figure 3.
DIDS-sensitive Na/2HCO3 cotransporter at the apical membrane. (A) 0.5 mM DIDS was added to the apical bath to obtain initial control response (pHi, TEP, and RT). The DIDS-induced response was then obtained in the presence of low (2.62 mM) HCO3 Ringer in the apical bath. After washout with control Ringer, DIDS was added to the apical bath to obtain the final control response. (B) Low HCO3 (2.62 mM) Ringer was perfused into the apical bath to obtain initial control response. The low basal bath [HCO3]-induced response was then obtained in the presence of 0.5 mM of apical DIDS. After DIDS washout, low basal bath [HCO3]-induced control response was obtained. Solid bars above the graphs represent solution changes from control Ringer as described in the legend to Fig. 2.
Figure 4.
Figure 4.
Effect of apical bath CO2 on apical membrane Na/2HCO3 cotransporter. (A) 0.5 mM DIDS was added to the apical bath to obtain initial control response. The DIDS-induced response was then obtained in the presence of 13% apical bath CO2. After washout with control Ringer, DIDS was added to the apical bath to obtain the final control response. (B) 13% CO2-equilibrated Ringer was perfused into the apical bath to record the initial control response. This maneuver was repeated in the presence of 0.5 mM of apical DIDS. After DIDS washout, 13% apical CO2-induced control response was obtained. Solid bars above the graphs represent solution changes from control Ringer as described in the legend to Fig. 2.
Figure 5.
Figure 5.
CA II dependence of apical membrane Na/2HCO3 cotransporter. Low HCO3 (2.62 mM) Ringer was perfused into the apical bath to record the initial control response. This maneuver was repeated in the presence of 250 µM of apical DZA. After DZA washout, low apical bath [HCO3]-induced control response was obtained. Solid bars above the graphs represent solution changes from control Ringer as described in the legend to Fig. 2.
Figure 6.
Figure 6.
DIDS sensitivity of basolateral membrane Cl/HCO3 exchanger. Low (1 mM) Cl Ringer was perfused into the apical bath to record the initial control response. This maneuver was repeated in the presence of 0.5 mM of apical DIDS. After DIDS washout, the low basal bath [Cl]-induced control response was obtained. Solid bars above the graphs represent solution changes from control Ringer as described in the legend to Fig. 2.
Figure 7.
Figure 7.
pH sensitivity of basolateral membrane Cl/HCO3 exchanger. Low (1 mM) Cl Ringer was perfused into the apical bath to record the initial control response. This maneuver was then repeated in (A) 13% or (B) 1% apical bath CO2. After returning to control Ringer, low basal bath [Cl]-induced control response was obtained. Solid bars above the graphs represent solution changes from control Ringer as described in the legend to Fig. 2.
Figure 8.
Figure 8.
DIDS sensitivity of basolateral membrane Na/nHCO3 cotransporter. Low HCO3 (2.62 mM) Ringer was perfused into the basal bath to record the pHi, TEP, and RT responses, first in the absence and then in the presence of 0.5 mM of basal DIDS. After DIDS washout, low basal bath [HCO3]-induced control response was obtained. Solid bars above the graphs represent solution changes from control Ringer as described in the legend to Fig. 2.
Figure 9.
Figure 9.
Na dependence of basolateral membrane Na/nHCO3 cotransporter. Low HCO3 (2.62 mM) Ringer was perfused into the basal bath to record the initial control response, and this maneuver was repeated in the absence of Na in both the apical and basal baths. After returning to control Ringer, low basal bath [HCO3]-induced control response was obtained. Solid bars above the graphs represent solution changes from control Ringer as described in the legend to Fig. 2.
Figure 10.
Figure 10.
Linked activity of the apical and basolateral membrane Na/HCO3 cotransporters. Low HCO3 (2.62 mM) Ringer was perfused into the basal bath to obtain the initial control response, and this maneuver was then repeated in the presence of 0.5 mM of apical DIDS. After DIDS washout, the low basal bath [HCO3]-induced control response was obtained. Solid bars above the graphs represent solution changes from control Ringer as described in the legend to Fig. 2.
Figure 11.
Figure 11.
CA II dependence of basolateral membrane Na/nHCO3 cotransporter. Low HCO3 (2.62 mM) Ringer was perfused into the basal bath to record the pHi, TEP, and RT responses, first in the absence and then in the presence of 250 µM of basal DZA. After DZA washout, low basal bath [HCO3]-induced control response was obtained. Solid bars above the graphs represent solution changes from control Ringer as described in the legend to Fig. 2.
Figure 12.
Figure 12.
Effect of apical bath CO2 on basolateral membrane Na/nHCO3 cotransporter. Low HCO3 (2.62 mM) Ringer was perfused into the basal bath to record the initial control response, and this maneuver was repeated in (A) 13% or (B) 1% apical bath CO2. After returning to control Ringer, low basal bath [HCO3]-induced control response was obtained. Solid bars above the graphs represent solution changes from control Ringer as described in the legend to Fig. 2.
Figure 13.
Figure 13.
CO2-induced changes in fluid absorption. 5% CO2 equilibrated Ringer was added to both solution baths, and JV was recorded with JV, TEP, and RT at steady state. The control Ringer was then replaced with either (A) 13% CO2 or (B) 1% CO2-equilibrated Ringer in both solution baths. JV, TEP, and RT values were recorded at steady state (15–30 min). Solid bars above the graphs represent solution changes from control Ringer as described in the legend to Fig. 2.

References

    1. Alm A., Bill A. 1987. Ocular circulation. Adler’s Physiology of the Eye. 8th ed Moses R.A., Hart W.M., Mosby, St. Louis, MO. 183–203
    1. Aronson P.S., Nee J., Suhm M.A. 1982. Modifier role of internal H+ in activating the Na+-H+ exchanger in renal microvillus membrane vesicles.Nature. 299:161–163 - PubMed
    1. Aronson P.S., Suhm M.A., Nee J. 1983. Interaction of external H+ with the Na+-H+ exchanger in renal microvillus membrane vesicles.J. Biol. Chem. 258:6767–6771 - PubMed
    1. Bevensee M.O., Schwiening C.J., Boron W.F. 1995. Use of BCECF and propidium iodide to assess membrane integrity of acutely isolated CA1 neurons from rat hippocampus.J. Neurosci. Methods. 58:61–75 - PubMed
    1. Bhosale P., Bernstein P.S. 2005. Quantitative measurement of 3′-oxolutein from human retina by normal-phase high-performance liquid chromatography coupled to atmospheric pressure chemical ionization mass spectrometry.Anal. Biochem. 345:296–301 - PubMed

Publication types