

Capitation and enhanced fee-for-service models for primary care reform: a population-based evaluation
- PMID: 19468106
- PMCID: PMC2683211
- DOI: 10.1503/cmaj.081316
Capitation and enhanced fee-for-service models for primary care reform: a population-based evaluation
Abstract
Background: Primary care reform in Ontario, Canada, included the initiation of a blended capitation model in 2001-2002 and an enhanced fee-for-service model in 2003. Both models involve patient rostering, incentives for preventive care and requirements for after-hours care. We evaluated practice characteristics and patterns of care under both models.
Methods: Using administrative data, we identified physicians belonging to either the capitation or the enhanced fee-for-service group throughout the period from Sept. 1, 2005, to Aug. 31, 2006, and their enrolled patients. Practices were stratified by location (urban v. rural). We compared the groups in terms of practice characteristics and patterns of care, including comprehensiveness of care, continuity of care, after-hours care, visits to the emergency department and uptake of new patients.
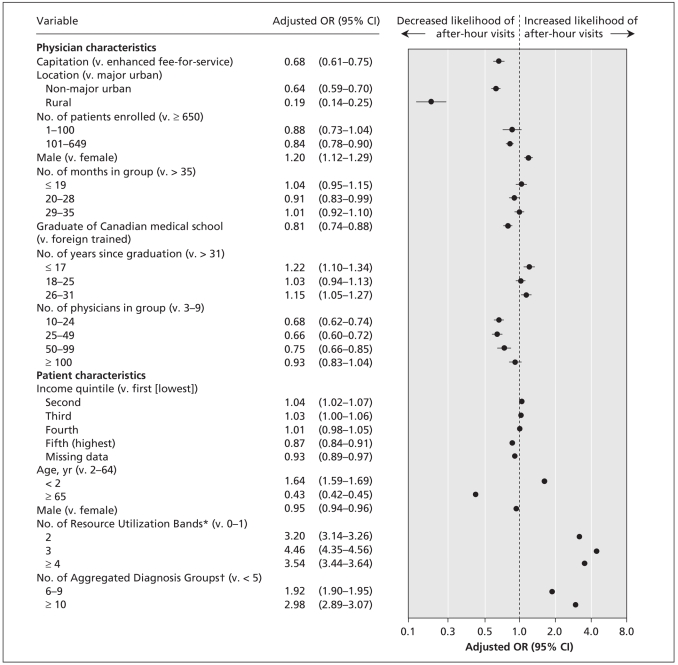
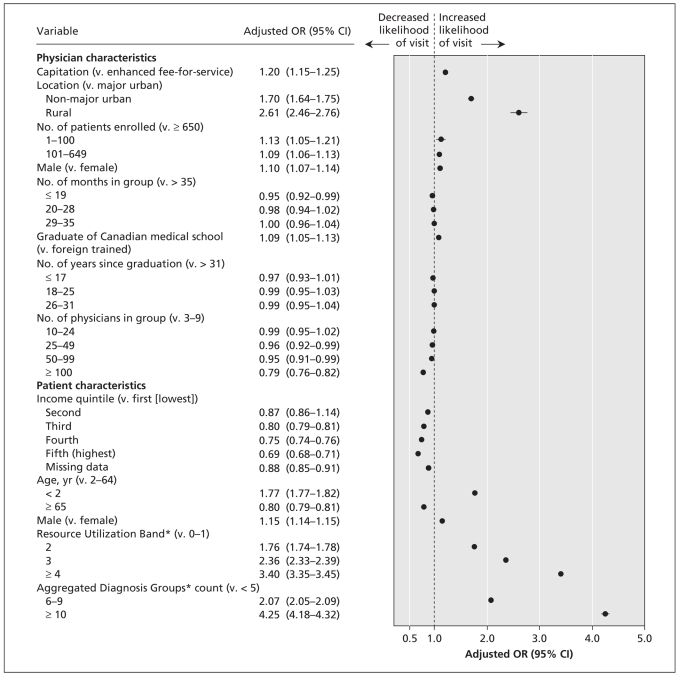
Results: Patients in the capitation and enhanced fee-for-service practices had similar demographic characteristics. Patients in capitation practices had lower morbidity and comorbidity indices. Comprehensiveness and continuity of care were similar between the 2 groups. Compared with patients in enhanced fee-for-service practices, those in capitation practices had less after-hours care (adjusted rate ratio [RR] 0.68, 95% confidence interval [CI] 0.61-0.75) and more visits to emergency departments (adjusted RR 1.20, 95% CI 1.15-1.25). Overall, physicians in the capitation group enrolled fewer new patients than did physicians in the enhanced fee-for-service group (37.0 v. 52.0 per physician); the same was true of new graduates (60.3 v. 72.1 per physician).
Interpretation: Physicians enrolled in the capitation model had different practice characteristics than those in the enhanced fee-for-service model. These characteristics appeared to be pre-existing and not due to enrolment in a new model. Although the capitation model provides an alternative to fee-for-service practice, its characteristics should be the focus of future policy development and research.
Figures
Comment in
-
Toward international primary care reform.CMAJ. 2009 May 26;180(11):1091-2. doi: 10.1503/cmaj.090542. CMAJ. 2009. PMID: 19468110 Free PMC article. Review. No abstract available.
Similar articles
-
Inclusion of persons with mental illness in patient-centred medical homes: cross-sectional findings from Ontario, Canada.Open Med. 2013 Feb 12;7(1):e9-20. Print 2013. Open Med. 2013. PMID: 23687535 Free PMC article.
-
Primary care services and emergency department visits in blended fee-for-service and blended capitation models: evidence from Ontario, Canada.Eur J Health Econ. 2024 Apr;25(3):363-377. doi: 10.1007/s10198-023-01591-w. Epub 2023 May 8. Eur J Health Econ. 2024. PMID: 37154832
-
Impact of remuneration and organizational factors on completing preventive manoeuvres in primary care practices.CMAJ. 2012 Feb 7;184(2):E135-43. doi: 10.1503/cmaj.110407. Epub 2011 Dec 5. CMAJ. 2012. PMID: 22143227 Free PMC article.
-
[Capitation fixed payment for primary care: a possible alternative to the traditional fee-for-service--part 2].Rev Med Brux. 1999 Feb;20(1):35-41. Rev Med Brux. 1999. PMID: 10091535 Review. French. No abstract available.
-
[Risk adjusted capitation is the basis for general practitioners' renumeration].Orv Hetil. 2019 Jul;160(27):1057-1063. doi: 10.1556/650.2019.31388. Orv Hetil. 2019. PMID: 31264470 Review. Hungarian.
Cited by
-
The effect of socioeconomic status on access to primary care: an audit study.CMAJ. 2013 Apr 2;185(6):E263-9. doi: 10.1503/cmaj.121383. Epub 2013 Feb 25. CMAJ. 2013. PMID: 23439620 Free PMC article. Clinical Trial.
-
Capitation-Based Financing Hampers the Provision of Preventive Services in Primary Health Care.Front Public Health. 2016 Sep 13;4:200. doi: 10.3389/fpubh.2016.00200. eCollection 2016. Front Public Health. 2016. PMID: 27679797 Free PMC article.
-
Patients' perceptions of the quality of care after primary care reform: Family medicine groups in Quebec.Can Fam Physician. 2010 Jul;56(7):e273-82. Can Fam Physician. 2010. PMID: 20631263 Free PMC article.
-
Multispecialty physician networks in Ontario.Open Med. 2013 May 14;7(2):e40-55. eCollection 2013. Open Med. 2013. PMID: 24348884 Free PMC article.
-
Progress of Ontario's Family Health Team model: a patient-centered medical home.Ann Fam Med. 2011 Mar-Apr;9(2):165-71. doi: 10.1370/afm.1228. Ann Fam Med. 2011. PMID: 21403144 Free PMC article.
References
-
- Bodenheimer T. Primary care — Will it survive? N Engl J Med. 2006;355:861–4. - PubMed
-
- Health Analysis and Measurement Group. Access to health care services in Canada, 2003. Ottawa (ON): Statistics Canada; 2003. [(accessed 2009 Apr. 28)]. Cat. no. 82-575-XIE. Available: www.statcan.gc.ca/pub/82-575-x/82-575-x2003001-eng.pdf.
-
- Tepper JD, Schultz SE, Rothwell DM, et al. Physician services in rural and Northern Ontario. ICES investigative report. Toronto (ON): Institute for Clinical Evaluative Sciences; 2005. [(accessed 2009 Feb. 23)]. Available: www.ices.on.ca/file/Physician_Services_in_Rural_and_Northern_Ontario.pdf.
-
- American Academy of Family Physicians, American Academy of Pediatrics, American College of Physicians, American Osteopathic Association. Joint principles of the patient-centered medical home. 2007. [(accessed 2009 Feb. 23)]. Available: www.medicalhomeinfo.org/Joint%20Statement.pdf.
-
- National Health Service. Quality and outcomes framework 2007/2008. London (UK): The Service; 2008. [(accessed 2009 Feb. 23)]. Available: www.qof.ic.nhs.uk/
Publication types
MeSH terms
LinkOut - more resources
Full Text Sources