A distinct pool of phosphatidylinositol 4,5-bisphosphate in caveolae revealed by a nanoscale labeling technique
- PMID: 19470488
- PMCID: PMC2695096
- DOI: 10.1073/pnas.0900216106
A distinct pool of phosphatidylinositol 4,5-bisphosphate in caveolae revealed by a nanoscale labeling technique
Erratum in
- Proc Natl Acad Sci U S A. 2009 Jul 14;106(28):11818
Abstract
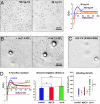
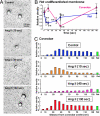
Multiple functionally independent pools of phosphatidylinositol 4,5-bisphosphate [PI(4,5)P(2)] have been postulated to occur in the cell membrane, but the existing techniques lack sufficient resolution to unequivocally confirm their presence. To analyze the distribution of PI(4,5)P(2) at the nanoscale, we developed an electron microscopic technique that probes the freeze-fractured membrane preparation by the pleckstrin homology domain of phospholipase C-delta1. This method does not require chemical fixation or expression of artificial probes, it is applicable to any cell in vivo and in vitro, and it can define the PI(4,5)P(2) distribution quantitatively. By using this method, we found that PI(4,5)P(2) is highly concentrated at the rim of caveolae both in cultured fibroblasts and mouse smooth muscle cells in vivo. PI(4,5)P(2) was also enriched in the coated pit, but only a low level of clustering was observed in the flat undifferentiated membrane. When cells were treated with angiotensin II, the PI(4,5)P(2) level in the undifferentiated membrane decreased to 37.9% within 10 sec and then returned to the initial level. Notably, the PI(4,5)P(2) level in caveolae showed a slower but more drastic change and decreased to 20.6% at 40 sec, whereas the PI(4,5)P(2) level in the coated pit was relatively constant and decreased only to 70.2% at 10 sec. These results show the presence of distinct PI(4,5)P(2) pools in the cell membrane and suggest a unique role for caveolae in phosphoinositide signaling.
Conflict of interest statement
The authors declare no conflict of interest.
Figures


Similar articles
-
The distribution of phosphatidylinositol 4,5-bisphosphate in acinar cells of rat pancreas revealed with the freeze-fracture replica labeling method.PLoS One. 2011;6(8):e23567. doi: 10.1371/journal.pone.0023567. Epub 2011 Aug 15. PLoS One. 2011. PMID: 21858170 Free PMC article.
-
Nanoscale analysis reveals agonist-sensitive and heterogeneous pools of phosphatidylinositol 4-phosphate in the plasma membrane.Biochim Biophys Acta. 2016 Jun;1858(6):1298-305. doi: 10.1016/j.bbamem.2016.03.011. Epub 2016 Mar 10. Biochim Biophys Acta. 2016. PMID: 26972044
-
Phosphatidylserine dictates the assembly and dynamics of caveolae in the plasma membrane.J Biol Chem. 2017 Aug 25;292(34):14292-14307. doi: 10.1074/jbc.M117.791400. Epub 2017 Jul 11. J Biol Chem. 2017. PMID: 28698382 Free PMC article.
-
Spelunking for lipids in caveolae.J Biol Chem. 2017 Aug 25;292(34):14308-14309. doi: 10.1074/jbc.H117.791400. J Biol Chem. 2017. PMID: 28842476 Free PMC article. Review.
-
Phosphoinositides in endocytosis.Biochim Biophys Acta. 2015 Jun;1851(6):794-804. doi: 10.1016/j.bbalip.2014.09.014. Epub 2014 Sep 28. Biochim Biophys Acta. 2015. PMID: 25264171 Review.
Cited by
-
Spotlight on the Binding Affinity of Ion Channels for Phosphoinositides: From the Study of Sperm Flagellum.Front Physiol. 2022 Feb 7;13:834180. doi: 10.3389/fphys.2022.834180. eCollection 2022. Front Physiol. 2022. PMID: 35197868 Free PMC article. Review.
-
Localization of the tubby domain, a PI(4,5)P2 biosensor, to E-Syt3-rich endoplasmic reticulum-plasma membrane junctions.J Cell Sci. 2023 Aug 1;136(15):jcs260848. doi: 10.1242/jcs.260848. Epub 2023 Aug 4. J Cell Sci. 2023. PMID: 37401342 Free PMC article.
-
Promotion of human mesenchymal stem cell osteogenesis by PI3-kinase/Akt signaling, and the influence of caveolin-1/cholesterol homeostasis.Stem Cell Res Ther. 2015 Dec 1;6:238. doi: 10.1186/s13287-015-0225-8. Stem Cell Res Ther. 2015. PMID: 26626726 Free PMC article.
-
Spoiled for Choice: Diverse Endocytic Pathways Function at the Cell Surface.Annu Rev Cell Dev Biol. 2019 Oct 6;35:55-84. doi: 10.1146/annurev-cellbio-100617-062710. Epub 2019 Jul 5. Annu Rev Cell Dev Biol. 2019. PMID: 31283376 Free PMC article. Review.
-
ENaC regulation by phospholipids and DGK explained through mathematical modeling.Sci Rep. 2020 Aug 18;10(1):13952. doi: 10.1038/s41598-020-70630-w. Sci Rep. 2020. PMID: 32811866 Free PMC article.
References
-
- Di Paolo G, De Camilli P. Phosphoinositides in cell regulation and membrane dynamics. Nature. 2006;443:651–657. - PubMed
-
- McLaughlin S, Wang J, Gambhir A, Murray D. PIP2 and proteins: Interactions, organization, and information flow. Annu Rev Biophys Biomol Struct. 2002;31:151–175. - PubMed
-
- Janmey PA, Lindberg U. Cytoskeletal regulation: Rich in lipids. Nat Rev Mol Cell Biol. 2004;5:658–666. - PubMed
-
- McLaughlin S, Murray D. Plasma membrane phosphoinositide organization by protein electrostatics. Nature. 2005;438:605–611. - PubMed
Publication types
MeSH terms
Substances
LinkOut - more resources
Full Text Sources
Other Literature Sources
Research Materials
Miscellaneous

