. 2009 Jun;20(6):1303-13.
doi: 10.1681/ASN.2008080844. Epub 2009 May 21.

Reduction of renal superoxide dismutase in progressive diabetic nephropathy

Affiliations

Reduction of renal superoxide dismutase in progressive diabetic nephropathy

Hiroki Fujita et al. J Am Soc Nephrol. 2009 Jun.

Abstract

Superoxide excess plays a central role in tissue damage that results from diabetes, but the mechanisms of superoxide overproduction in diabetic nephropathy (DN) are incompletely understood. In the present study, we investigated the enzyme superoxide dismutase (SOD), a major defender against superoxide, in the kidneys during the development of murine DN. We assessed SOD activity and the expression of SOD isoforms in the kidneys of two diabetic mouse models (C57BL/6-Akita and KK/Ta-Akita) that exhibit comparable levels of hyperglycemia but different susceptibility to DN. We observed down-regulation of cytosolic CuZn-SOD (SOD1) and extracellular CuZn-SOD (SOD3), but not mitochondrial Mn-SOD (SOD2), in the kidney of KK/Ta-Akita mice which exhibit progressive DN. In contrast, we did not detect a change in renal SOD expression in DN-resistant C57BL/6-Akita mice. Consistent with these findings, there was a significant reduction in total SOD activity in the kidney of KK/Ta-Akita mice compared with C57BL/6-Akita mice. Finally, treatment of KK/Ta-Akita mice with a SOD mimetic, tempol, ameliorated the nephropathic changes in KK/Ta-Akita mice without altering the level of hyperglycemia. Collectively, these results indicate that down-regulation of renal SOD1 and SOD3 may play a key role in the pathogenesis of DN.


Figures
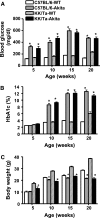
Figure 1.
Figure 1.
Development of diabetes in male KK/Ta-Akita and C57BL/6-Akita mice. Six hours-fasting blood glucose (A), HbA1c (B), and body weight (C) were measured every 5 wk after birth. Values are means ± SEM of at least eight mice. *P < 0.001; +P < 0.05 versus counterpart WT mice.
Figure 2.
Figure 2.
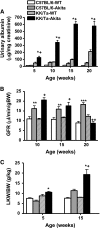
Renal changes in male KK/Ta-Akita and C57BL/6-Akita mice. (A) Urinary albumin excretion was assessed by the determination of urine ACR (n = 8 per group). (B) GFR was measured by FITC-inulin clearance method in conscious mice (n = 8 per group). (C) LKW/BW was assessed at 5 and 15 wk of age (n = 6 per group). Values are means ± SEM. *P < 0.001 versus C57BL/6-Akita mice; +P < 0.001; ++P < 0.05 versus KK/Ta-WT mice; **P < 0.05; ***P < 0.001 versus C57BL/6-WT mice.
Figure 3.
Figure 3.
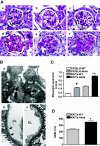
Morphology of KK/Ta-Akita glomeruli. (A) Representative glomerular histopathology in each group mice at 15 to 20 wk of age. (a) C57BL/6-WT (15 wk old), (b) C57BL/6-Akita (15 wk old), (c) KK/Ta-WT (15 wk old), (d) KK/Ta-Akita (15 wk old), (e and f) KK/Ta-Akita (20 wk old). PAS stain, original magnification: ×400. (B) Representative glomerular electron micrographs from 15-wk-old KK/Ta-Akita and KK/Ta-WT mice. (a and b) KK/Ta-Akita, (c) KK/Ta-WT. Arrows indicate irregular thickening of GBM. Asterisks indicate mesangial matrix expansion. CL, capillary lumen; En, endothelial cells; MΦ, macrophage; Mes, mesangial cells. Original magnification, ×5000 in a) ×15,000 in b and c. (C) Glomerular mesangial expansion scores of 15-wk-old mice. The scores were determined on perfusion-fixed PAS-stained kidney sections as described in the Concise Methods section. Data are presented as means ± SEM. #P < 0.001 versus C57BL/6-WT mice; *P < 0.001 versus C57BL/6-Akita mice; +P < 0.001 versus KK/Ta-WT mice; n = 6 per group. (D) GBM thickness in 15-wk-old KK/Ta-Akita and KK/Ta-WT mice. Data are presented as means ± SEM; +P < 0.0001 versus KK/Ta-WT mice; n = 6 per group.
Figure 4.
Figure 4.
Renal superoxide production and SOD activity and expression in KK/Ta-Akita and C57BL/6-Akita mice. (A) Renal superoxide production in 15-wk-old mice. Data are presented as means ± SEM. SOD+, kidney tissue preincubated with SOD-PEG protein. SOD-, kidney tissue without SOD-PEG protein. *P < 0.05 versus SOD- C57BL/6-WT kidney; +P < 0.001 versus SOD- KK/Ta-WT kidney; #P < 0.01 versus SOD- C57BL/6-Akita kidney; n = 6 per group. (B) Representative glomerular DHE staining in 15-wk-old mice. (a) C57BL/6-WT, (b) C57BL/6-Akita, (c) KK/Ta-WT, (d) KK/Ta-Akita. Original magnification, ×400. (C) Renal SOD activity at 5 and 15 wk of age. Data are presented as means ± SEM. *P < 0.05 versus C57BL/6-Akita mice; +P < 0.001 versus KK/Ta-WT mice; n = 8 per group. (D) Western blot analysis of renal SOD isoform expression in 15-wk-old mice. The relative intensity of SOD-to-actin ratio to the C57BL/6-WT mice is also shown (lower panel). Data are presented as means ± SEM. +P < 0.001 versus KK/Ta-WT mice; *P < 0.001 versus C57BL/6-Akita mice; n = 4 per group.
Figure 5.
Figure 5.
Immunofluorescence SOD isoform staining of 15-wk-old mouse kidney sections. (A to D) SOD1, (E to H) SOD2, (I to L) SOD3, (A, E, and I) C57BL/6-WT mice, (B, F, and J) C57BL/6-Akita mice, (C, G, and K) KK/Ta-WT mice, (D, H, and L) KK/Ta-Akita mice. Arrows indicate glomeruli. Original magnification, ×200 in A through D, ×100 in E through H, and ×400 in I through L.
Figure 6.
Figure 6.
Effects of tempol on DN in KK/Ta-Akita mice. The tempol treatment started at 10 wk of age (0 wk) and ended at 14 wk of age (4 wk). (A) Changes in urinary albumin excretion levels. Values are means ± SEM. *P < 0.01; #P < 0.0001; n = 6 per group. (B) Changes in GFR. Values are means ± SEM. **P < 0.05; n = 6 per group. (C) LKW/BW in KK/Ta-WT and KK/Ta-Akita mice after 4-wk treatment. Values are means ± SEM. **P < 0.05; n = 6 per group. (D) Representative glomerular DHE stain (upper panels) and renal superoxide production (lower panel) in KK/Ta-WT and KK/Ta-Akita mice after 4-wk treatment. Data are presented as means ± SEM. ##P < 0.001; n = 5 per group. SOD+, kidney tissue preincubated with SOD-PEG protein; SOD-, kidney tissue without SOD-PEG protein. Original magnification (upper panels), ×400. (E) Representative light microscopic images of the KK/Ta-Akita glomeruli after 4-wk treatment. (a and b) vehicle-treated, (c and d) tempol-treated. PAS stain, original magnification, ×400. (F) Glomerular mesangial expansion scores in KK/Ta-WT and KK/Ta-Akita mice after 4-wk treatment. Values are means ± SEM. *P < 0.01; n = 6 per group.

References

    1. Krolewski AS: Genetics of diabetic nephropathy: Evidence for major and minor gene effects. Kidney Int 55: 1582–1596, 1999 - PubMed
    1. Freedman BI, Bostrom M, Daeihagh P, Bowden DW: Genetic factors in diabetic nephropathy. Clin J Am Soc Nephrol 2: 1306–1316, 2007 - PubMed
    1. Brownlee M: The pathobiology of diabetic complications: A unifying mechanism. Diabetes 54: 1615–1625, 2005 - PubMed
    1. Brownlee M: Biochemistry and molecular cell biology of diabetic complications. Nature 414: 813–820, 2001 - PubMed
    1. Li JM, Shah AM: Endothelial cell superoxide generation: regulation and relevance for cardiovascular pathophysiology. Am J Physiol Regul Integr Comp Physiol 287: R1014–R1030, 2004 - PubMed

Publication types