

Patterns of gene expression and copy-number alterations in von-hippel lindau disease-associated and sporadic clear cell carcinoma of the kidney
- PMID: 19470766
- PMCID: PMC2745239
- DOI: 10.1158/0008-5472.CAN-09-0146
Patterns of gene expression and copy-number alterations in von-hippel lindau disease-associated and sporadic clear cell carcinoma of the kidney
Abstract
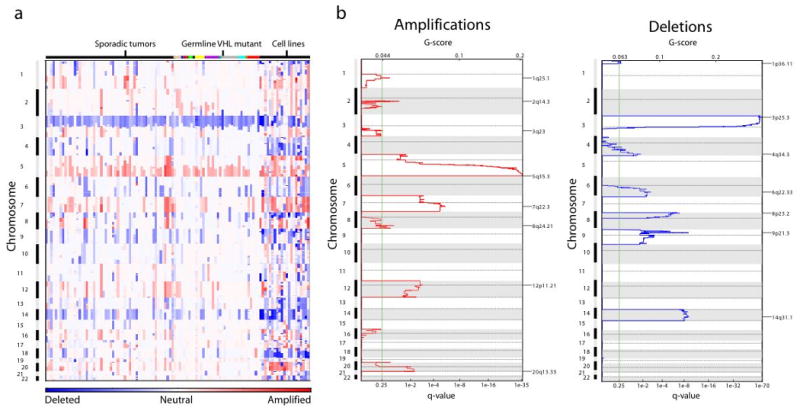
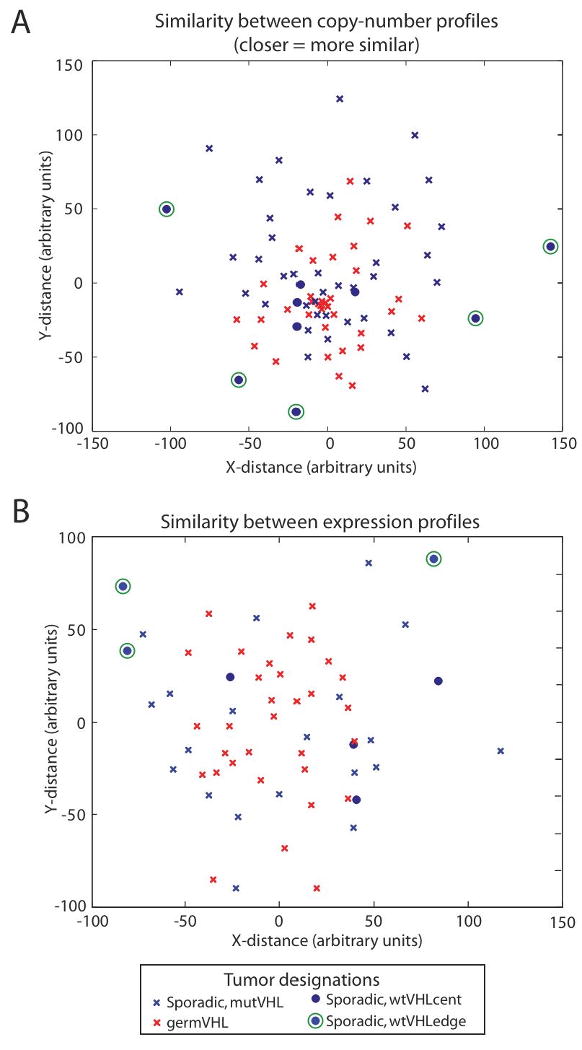
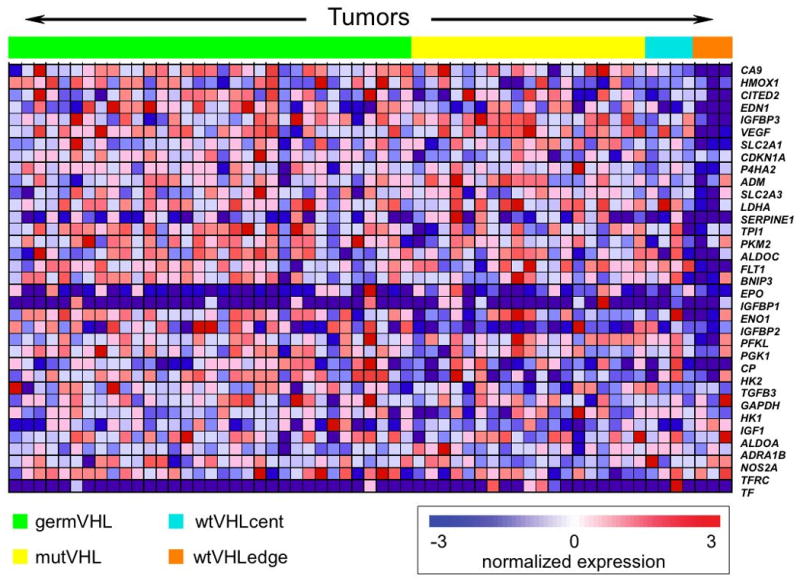
Recent insights into the role of the von-Hippel Lindau (VHL) tumor suppressor gene in hereditary and sporadic clear-cell renal cell carcinoma (ccRCC) have led to new treatments for patients with metastatic ccRCC, although virtually all patients eventually succumb to the disease. We performed an integrated, genome-wide analysis of copy-number changes and gene expression profiles in 90 tumors, including both sporadic and VHL disease-associated tumors, in hopes of identifying new therapeutic targets in ccRCC. We identified 14 regions of nonrandom copy-number change, including 7 regions of amplification (1q, 2q, 5q, 7q, 8q, 12p, and 20q) and 7 regions of deletion (1p, 3p, 4q, 6q, 8p, 9p, and 14q). An analysis aimed at identifying the relevant genes revealed VHL as one of three genes in the 3p deletion peak, CDKN2A and CDKN2B as the only genes in the 9p deletion peak, and MYC as the only gene in the 8q amplification peak. An integrated analysis to identify genes in amplification peaks that are consistently overexpressed among amplified samples confirmed MYC as a potential target of 8q amplification and identified candidate oncogenes in the other regions. A comparison of genomic profiles revealed that VHL disease-associated tumors are similar to a subgroup of sporadic tumors and thus more homogeneous overall. Sporadic tumors without evidence of biallelic VHL inactivation fell into two groups: one group with genomic profiles highly dissimilar to the majority of ccRCC and a second group with genomic profiles that are much more similar to tumors with biallelic inactivation of VHL.
Figures
References
-
-
http://seer.cancer.gov/csr/1975_2005/, based on November 2007 SEER data submission, posted to the SEER web site, 2008
-
-
- McDermott DF, Rini BI. Immunotherapy for metastatic renal cell carcinoma. BJU Int. 2007;99:1282–8. - PubMed
-
- Latif F, Tory K, Gnarra J, et al. Identification of the von Hippel-Lindau disease tumor suppressor gene. Science. 1993;260:1317–20. - PubMed
-
- Kaelin WG., Jr The von Hippel-Lindau tumor suppressor gene and kidney cancer. Clin Cancer Res. 2004;10:6290S–5S. - PubMed
-
- Linehan WM, Grubb RL, Coleman JA, Zbar B, Walther MM. The genetic basis of cancer of kidney cancer: implications for gene-specific clinical management. BJU Int. 2005;95 2:2–7. - PubMed
Publication types
MeSH terms
Substances
Grants and funding
LinkOut - more resources
Full Text Sources
Other Literature Sources
Medical
Molecular Biology Databases
Research Materials
Miscellaneous
