. 2009 Jun 9;119(22):2928-35.
doi: 10.1161/CIRCULATIONAHA.108.823609. Epub 2009 May 26.

Vascular regeneration by local growth factor release is self-limited by microvascular clearance

Affiliations

Vascular regeneration by local growth factor release is self-limited by microvascular clearance

Kha N Le et al. Circulation. .

Abstract

Background: The challenge of angiogenesis science is that stable sustained vascular regeneration in humans has not been realized despite promising preclinical findings. We hypothesized that angiogenic therapies powerfully self-regulate by dynamically altering tissue characteristics. Induced neocapillaries increase drug clearance and limit tissue retention and subsequent angiogenesis even in the face of sustained delivery.

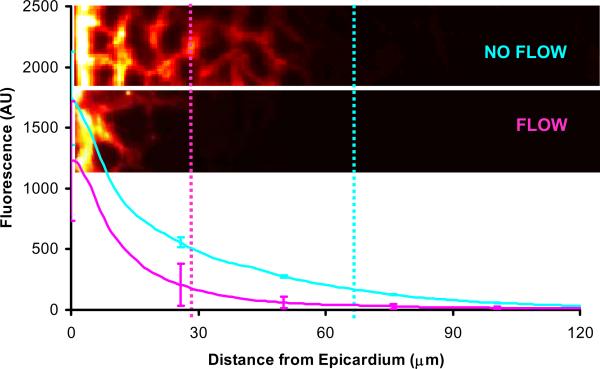
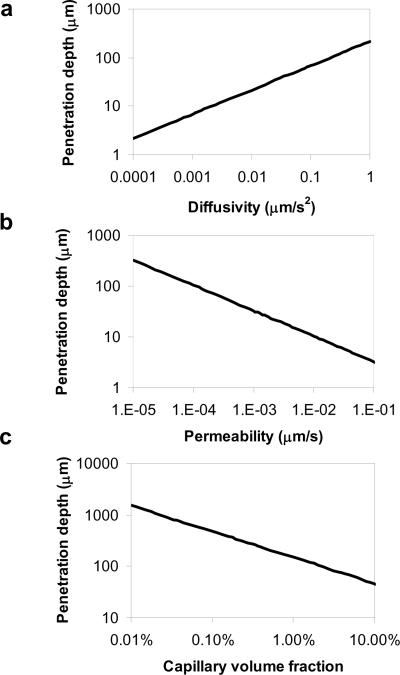
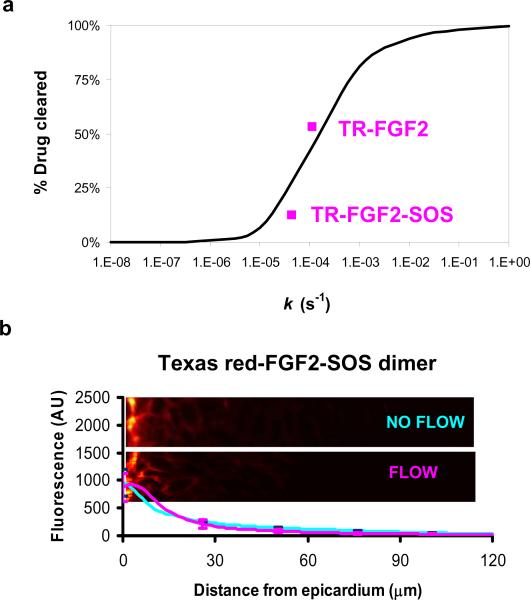
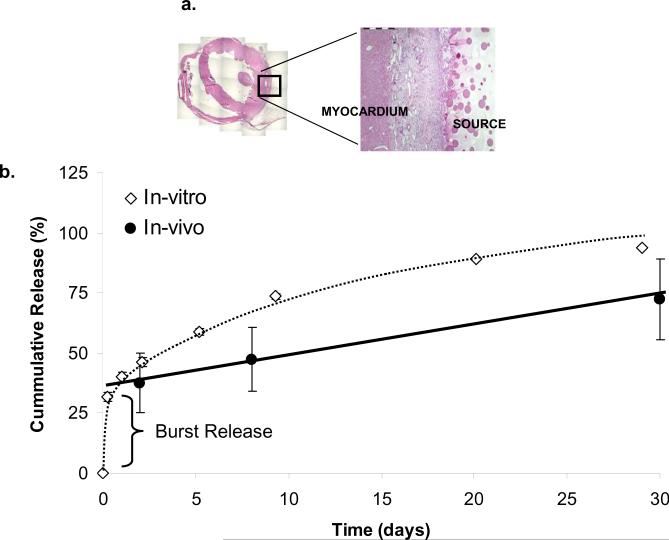
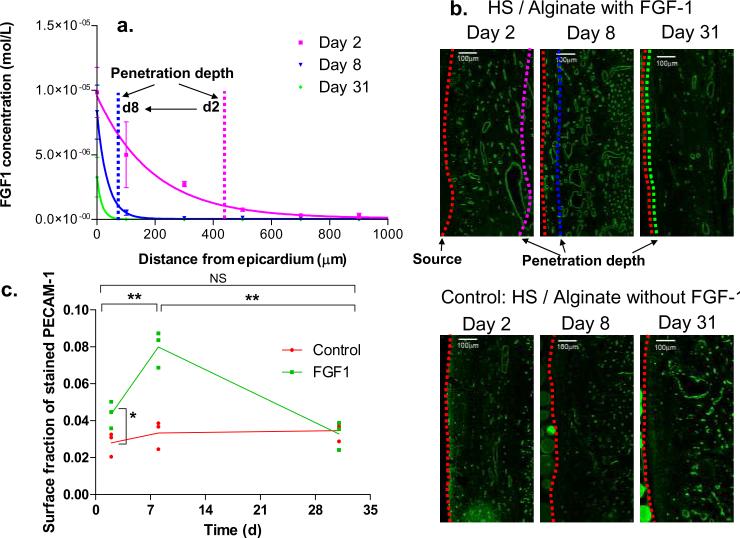
Methods and results: We quantified how capillary flow clears fibroblast growth factor after local epicardial delivery. Fibroblast growth factor spatial loading was significantly reduced with intact coronary perfusion. Penetration and retention decreased with transendothelial permeability, a trend diametrically opposite to intravascular delivery, in which factor delivery depends on vascular leak, but consistent with a continuum model of drug transport in perfused tissues. Model predictions of fibroblast growth factor sensitivity to manipulations of its diffusivity and transendothelial permeability were validated by conjugation to sucrose octasulfate. Induction of neocapillaries adds pharmacokinetic complexity. Sustained local fibroblast growth factor delivery in vivo produced a burst of neovascularization in ischemic myocardium but was followed by drug washout and a 5-fold decrease in fibroblast growth factor penetration depth.

Conclusions: The very efficacy of proangiogenic compounds enhances their clearance and abrogates their pharmacological benefit. This self-limiting property of angiogenesis may explain the failures of promising proangiogenic therapies.


Figures

FIGURE 1
FIGURE 1. Myocardial Capillary perfusion Impedes Drug Penetration
Distribution and representative fluorescence microscopy images of TR-FGF2 in rat myocardium with (magenta) and without coronary perfusion (blue). Data represent mean ± s.e.m. (n=3). Penetration depth (x90) is estimated as the location of the 90 % drop-off from the threshold (vertical dashed lines).
FIGURE 2
FIGURE 2. Continuum Pharmacokinetic Model
Penetration depth x90,defined as distance from source to 90 % drop-off threshold, x90 = ℓ × ln(10), where ℓ is calculated based on Eq. 4 (Table 1), is expressed as a function of drug diffusivity (a), trans-endothelial permeability (b), and capillary volume fraction (c). Parameter values cover a range of two orders of magnitude below to above those of FGF2 in the heart. FGF2 diffusivity = 0.02 μm2s−1 and clearance constants k were empirically verified, and trans-endothelial permeability derived from Eq. 2 (Table 1). Capillary volume fraction (ϕmv) was varied over 3 log orders between the extremes of ischemic and normal tissue vascularity. These relationships are linear in log-log scale axes, demonstrating adherence to power law functions.
FIGURE 3
FIGURE 3. FGF Distribution is Sensitive to Alteration in Drug Clearance
(a) Percent drug cleared by capillaries calculated using the analytical model (Eq. 5, Table 1) as a function of clearance rate constant k (black line). Experimental data points for TR-FGF2 and TR-(FGF2)2-SOS analyzed by Eq. M1 (Methods) are superimposed (magenta squares) on model predictions providing perspective on the sensitivity of FGF2 to manipulation of its clearance constant. (b) Distribution and representative fluorescence microscopy images of TR-(FGF2)2-SOS in rat myocardium with coronary perfusion (magenta) and without coronary perfusion (blue). Data represent mean ± s.e.m. (n=3).
FIGURE 4
FIGURE 4. Polymeric Devices Sustain Release FGF1 over 30 days
(a) Cross sectional area of H&E stained rabbit myocardial tissue shows location of drug release source (adjacent to left ventricular free wall) and interface between drug source and myocardium. (b) Percentage of cumulative 35S-FGF1 released into PBS buffer in-vitro (white diamonds, data represent mean ± s.e.m. (n=10), 100% corresponds to approximately 90μg 35S-FGF1 per circular disk of 8mm diameter and 1mm thickness), and throughout in-vivo experiment (black circles, data represent mean ± s.e.m. (n=3), 100% corresponds to approximately 450 μg 35S-FGF1 per device (20mm × 20mm × 1mm) for in-vivo experiments), calculated by % drug released = (total drug within source – total drug remaining)/ total drug within source × 100 %.
FIGURE 5
FIGURE 5. In-vivo Ischemic Heart Model
(a) Spatial distributions of tissue S35-FGF1 concentration at days 2, 8, and 31 following coronary ligation and implantation of sustained release source. FGF1 was quantified using liquid scintillation counting following serial sectioning. Data represent mean ± s.e.m. (n=3) (b) Representative fluorescent images of PECAM-1 labeled blood vessels in tissue regions adjacent to drug source for experimental animals receiving heparin-Sepharose beads / alginate source with S35-FGF1 and control animals receiving devices without FGF1. Dashed red line on the right edge denotes interface between source and epicardium. Magenta, blue and green dashed lines represent the penetration depth at 90 % drop-off threshold from tissue/source interface calculated from spatial S35-FGF1 distributions. (c) Vascular to tissue surface fraction (calculated by normalizing total number of pixels stained by PECAM-1 to total tissue area within 500 μm depth from source) is expressed as a function of time. Scale bars represent 100 μm. Data points represent PECAM-1 stained surface fraction of individual hearts (n=3), and connecting lines denote trend of mean value. * denotes P < 0.05. ** denotes P < 0.01 (P = 0.007 between days 2 and 8, and P = 0.003 between days 8 and 31).

References

    1. Yanagisawa-Miwa A, Uchida Y, Nakamura F, Tomaru T, Kido H, Kamijo T, Sugimoto T, Kaji K, Utsuyama M, Kurashima C. Salvage of infarcted myocardium by angiogenic action of basic fibroblast growth factor. Science. 1992;257:1401–1403. - PubMed
    1. Takeshita S, Pu LQ, Stein LA, Sniderman AD, Bunting S, Ferrara N, Isner JM, Symes JF. Intramuscular administration of vascular endothelial growth factor induces dose-dependent collateral artery augmentation in a rabbit model of chronic limb ischemia. Circulation. 1994;90:II228–234. - PubMed
    1. Harada K, Friedman M, Lopez JJ, Wang SY, Li J, Prasad PV, Pearlman JD, Edelman ER, Sellke FW, Simons M. Vascular endothelial growth factor administration in chronic myocardial ischemia. Am J Physiol. 1996;270:H1791–1802. - PubMed
    1. Lopez JJ, Edelman ER, Stamler A, Hibberd MG, Prasad P, Thomas KA, DiSalvo J, Caputo RP, Carrozza JP, Douglas PS, Sellke FW, Simons M. Angiogenic potential of perivascularly delivered aFGF in a porcine model of chronic myocardial ischemia. Am J Physiol. 1998;274:H930–936. - PubMed
    1. Montesano R, Vassalli JD, Baird A, Guillemin R, Orci L. Basic fibroblast growth factor induces angiogenesis in vitro. Proc Natl Acad Sci U S A. 1986;83:7297–7301. - PMC - PubMed

Publication types

Substances