

Variability of interpretive accuracy among diagnostic mammography facilities
- PMID: 19470953
- PMCID: PMC2689871
- DOI: 10.1093/jnci/djp105
Variability of interpretive accuracy among diagnostic mammography facilities
Abstract
Background: Interpretive performance of screening mammography varies substantially by facility, but performance of diagnostic interpretation has not been studied.
Methods: Facilities performing diagnostic mammography within three registries of the Breast Cancer Surveillance Consortium were surveyed about their structure, organization, and interpretive processes. Performance measurements (false-positive rate, sensitivity, and likelihood of cancer among women referred for biopsy [positive predictive value of biopsy recommendation {PPV2}]) from January 1, 1998, through December 31, 2005, were prospectively measured. Logistic regression and receiver operating characteristic (ROC) curve analyses, adjusted for patient and radiologist characteristics, were used to assess the association between facility characteristics and interpretive performance. All statistical tests were two-sided.
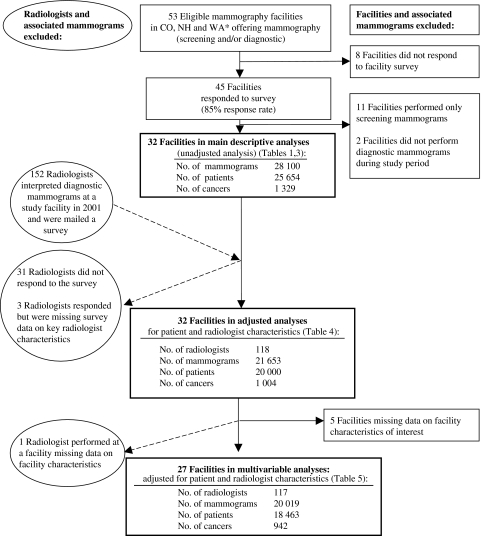
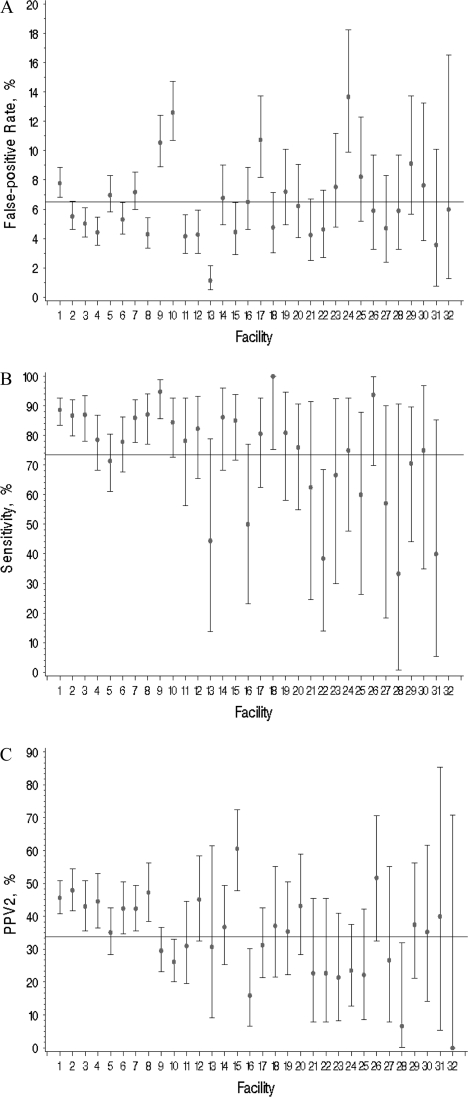
Results: Forty-five of the 53 facilities completed a facility survey (85% response rate), and 32 of the 45 facilities performed diagnostic mammography. The analyses included 28 100 diagnostic mammograms performed as an evaluation of a breast problem, and data were available for 118 radiologists who interpreted diagnostic mammograms at the facilities. Performance measurements demonstrated statistically significant interpretive variability among facilities (sensitivity, P = .006; false-positive rate, P < .001; and PPV2, P < .001) in unadjusted analyses. However, after adjustment for patient and radiologist characteristics, only false-positive rate variation remained statistically significant and facility traits associated with performance measures changed (false-positive rate = 6.5%, 95% confidence interval [CI] = 5.5% to 7.4%; sensitivity = 73.5%, 95% CI = 67.1% to 79.9%; and PPV2 = 33.8%, 95% CI = 29.1% to 38.5%). Facilities reporting that concern about malpractice had moderately or greatly increased diagnostic examination recommendations at the facility had a higher false-positive rate (odds ratio [OR] = 1.48, 95% CI = 1.09 to 2.01) and a non-statistically significantly higher sensitivity (OR = 1.74, 95% CI = 0.94 to 3.23). Facilities offering specialized interventional services had a non-statistically significantly higher false-positive rate (OR = 1.97, 95% CI = 0.94 to 4.1). No characteristics were associated with overall accuracy by ROC curve analyses.
Conclusions: Variation in diagnostic mammography interpretation exists across facilities. Failure to adjust for patient characteristics when comparing facility performance could lead to erroneous conclusions. Malpractice concerns are associated with interpretive performance.
Figures
References
-
- Sickles EA, Miglioretti DL, Ballard-Barbash RD, et al. Performance benchmarks for diagnostic mammography. Radiology. 2005;235(3):775–790. - PubMed
-
- Barlow WE, Lehman CD, Zheng Y, et al. Performance of diagnostic mammography in women with breast signs or symptoms. J Natl Cancer Inst. 2002;94(15):1151–1159. - PubMed
-
- Sickles EA, Wolverton DE, Dee KE. Performance parameters for screening and diagnostic mammography: specialist and general radiologists. Radiology. 2002;224(3):861–869. - PubMed
Publication types
MeSH terms
Grants and funding
- U01CA69976/CA/NCI NIH HHS/United States
- U01CA70013/CA/NCI NIH HHS/United States
- U01 CA086082/CA/NCI NIH HHS/United States
- U01CA63736/CA/NCI NIH HHS/United States
- U01CA86082/CA/NCI NIH HHS/United States
- K05 CA104699/CA/NCI NIH HHS/United States
- U01CA86076/CA/NCI NIH HHS/United States
- R01 CA-107623/CA/NCI NIH HHS/United States
- R01 HS-010591/HS/AHRQ HHS/United States
- K05 CA-104699/CA/NCI NIH HHS/United States
- U01CA63731/CA/NCI NIH HHS/United States
- U01CA70040/CA/NCI NIH HHS/United States
- U01CA63740/CA/NCI NIH HHS/United States
LinkOut - more resources
Full Text Sources
Medical
