. 2009 Jul;8(13):1212-3.
doi: 10.4161/cbt.8.13.8630. Epub 2009 Jul 6.

Overexpression of lecithin:retinol acyltransferase in the epithelial basal layer makes mice more sensitive to oral cavity carcinogenesis induced by a carcinogen

Affiliations

Overexpression of lecithin:retinol acyltransferase in the epithelial basal layer makes mice more sensitive to oral cavity carcinogenesis induced by a carcinogen

Xiao-Han Tang et al. Cancer Biol Ther. 2009 Jul.

Abstract

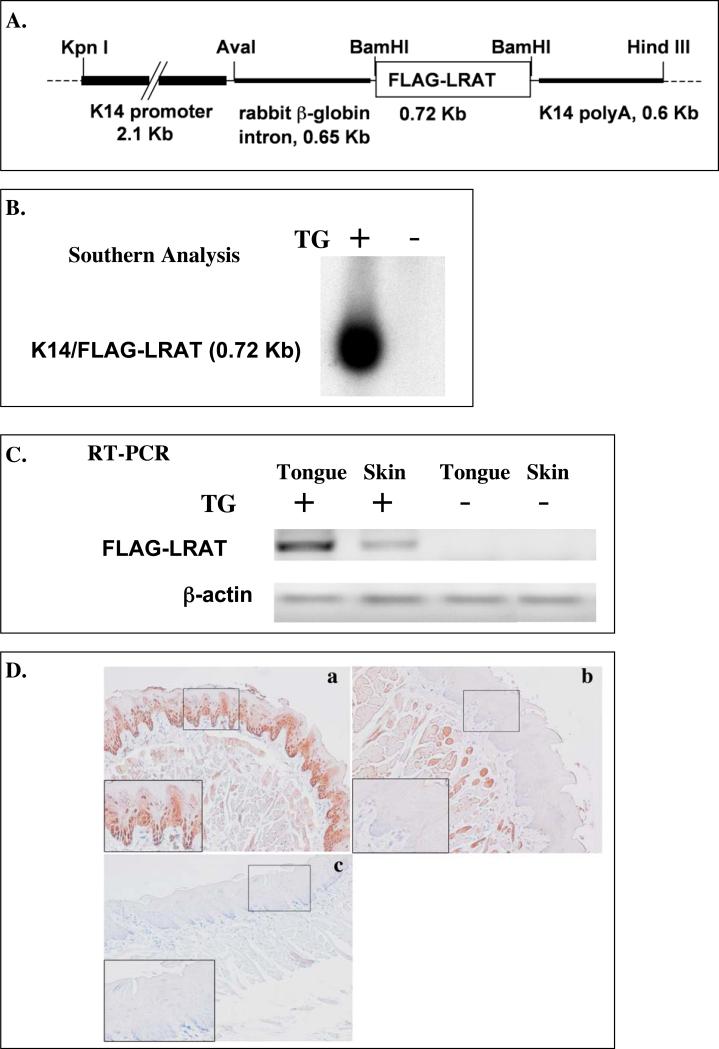
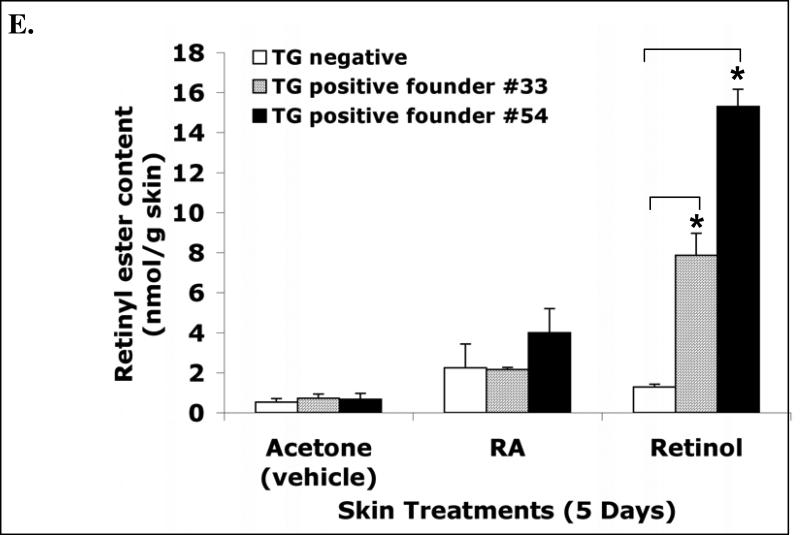
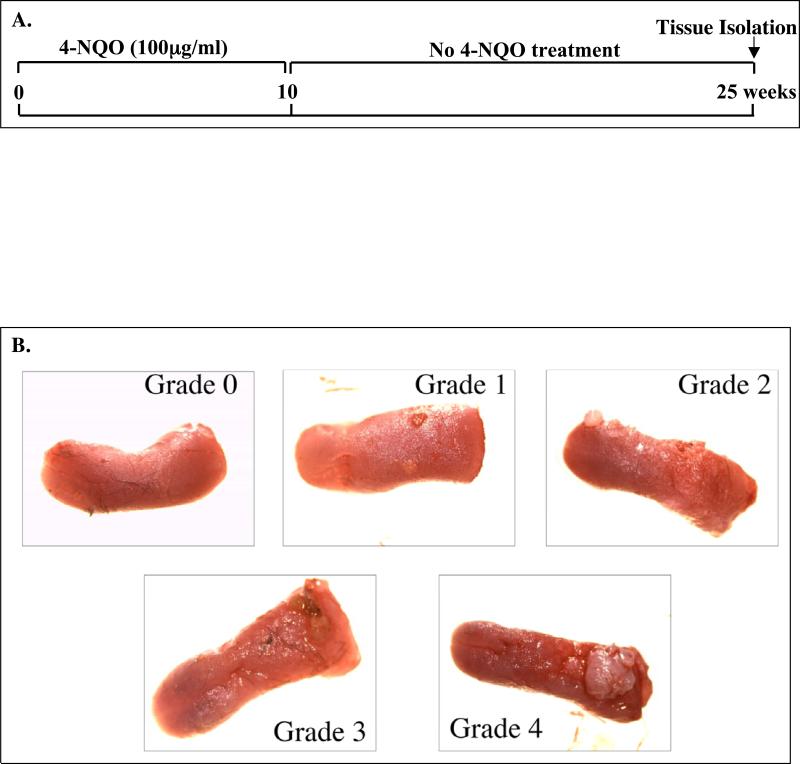
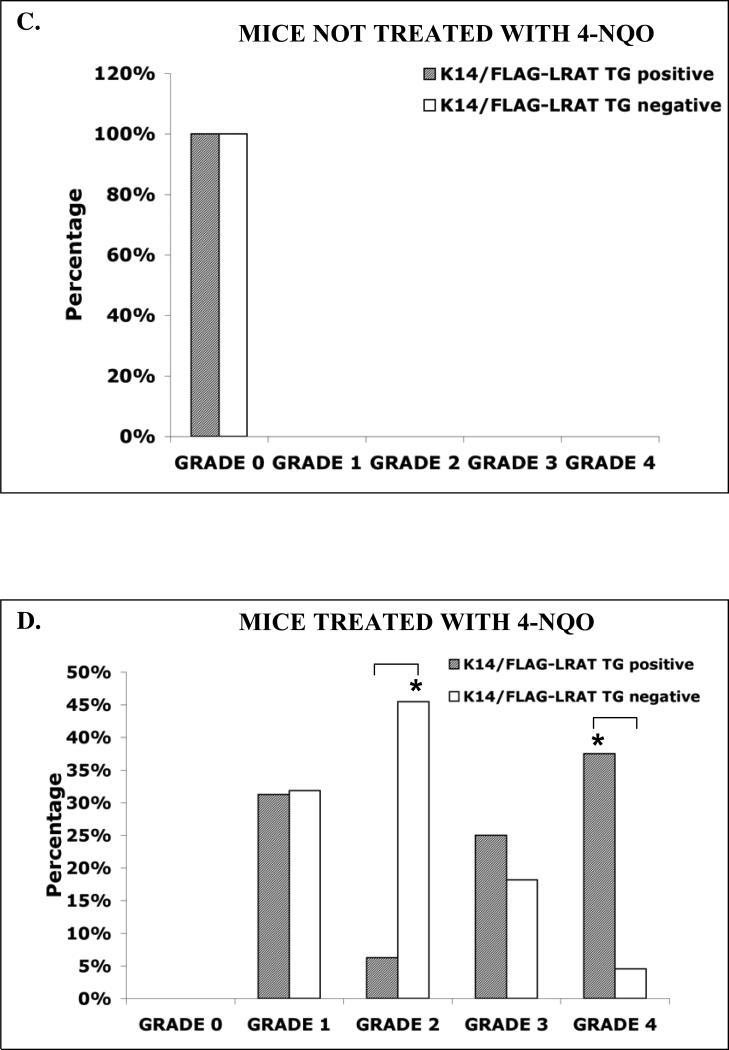
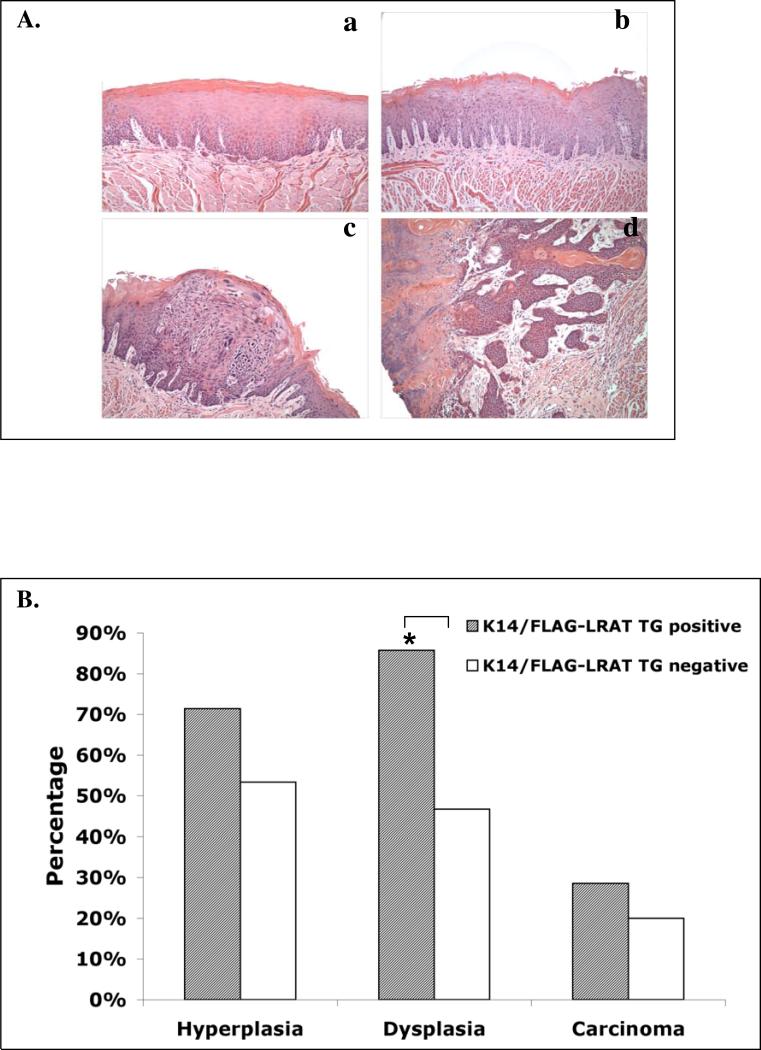
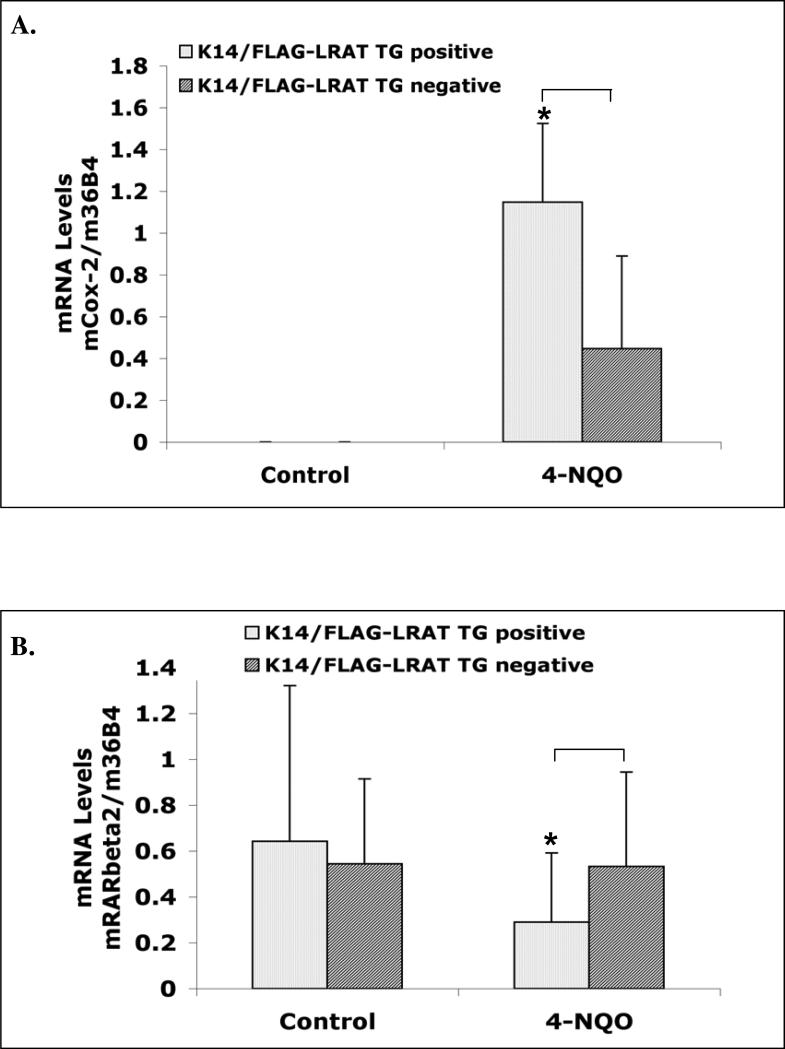
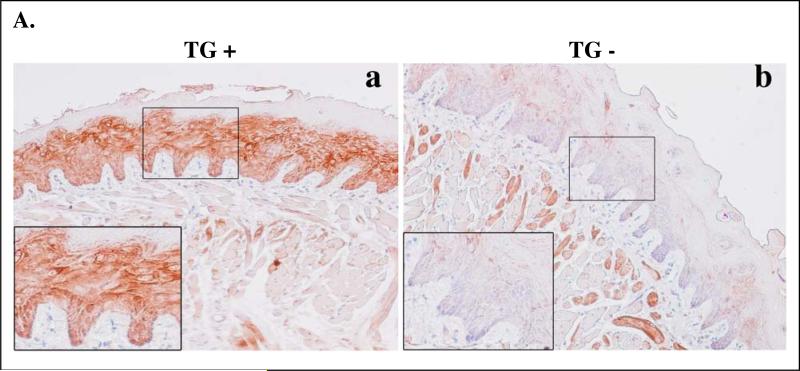
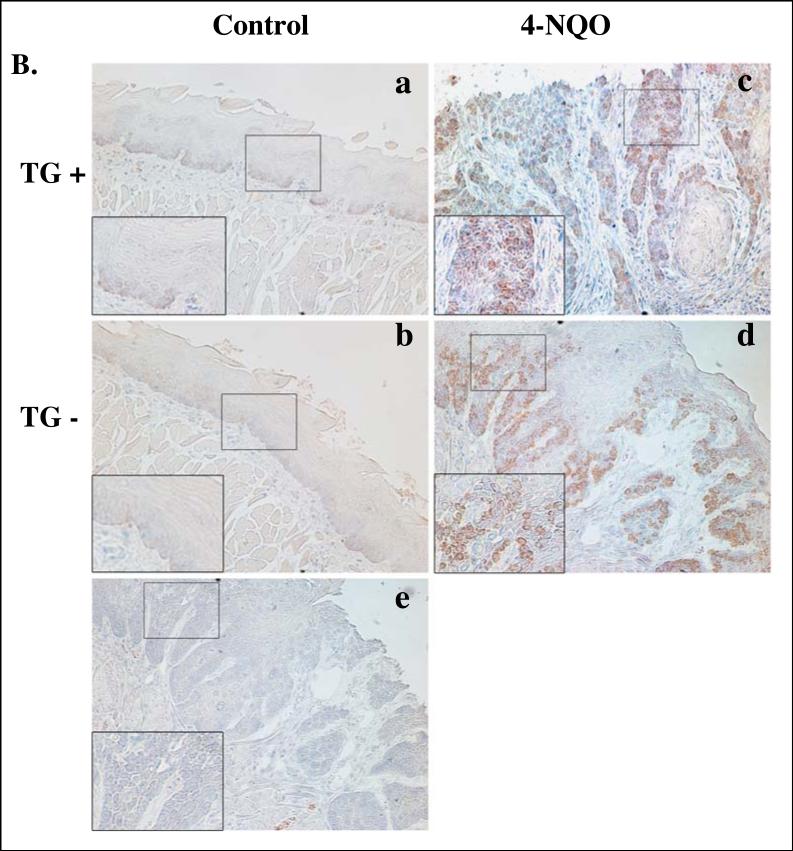
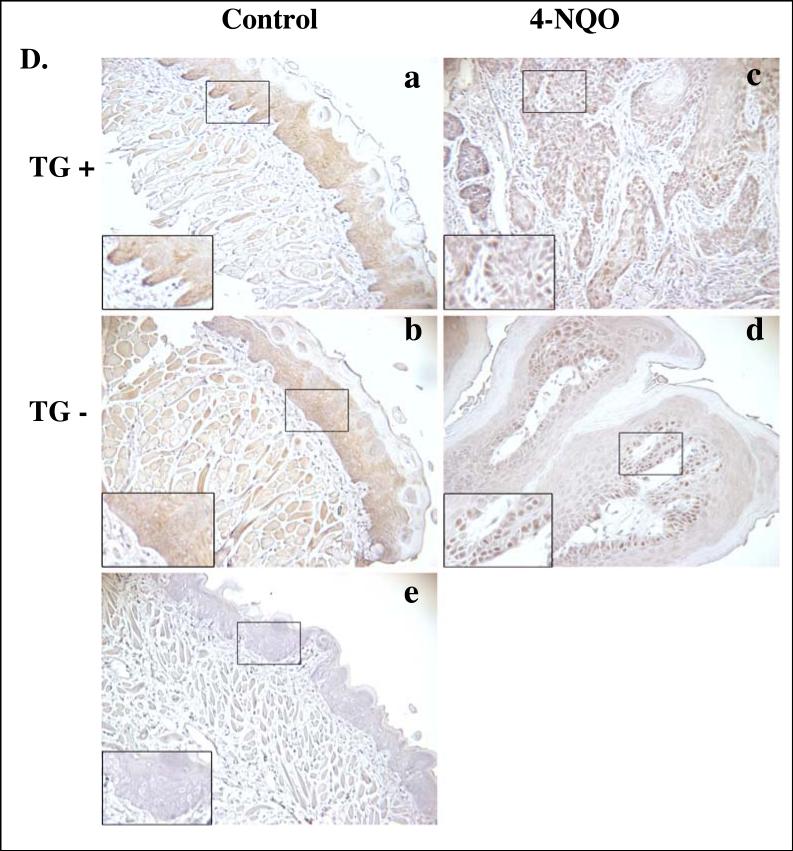
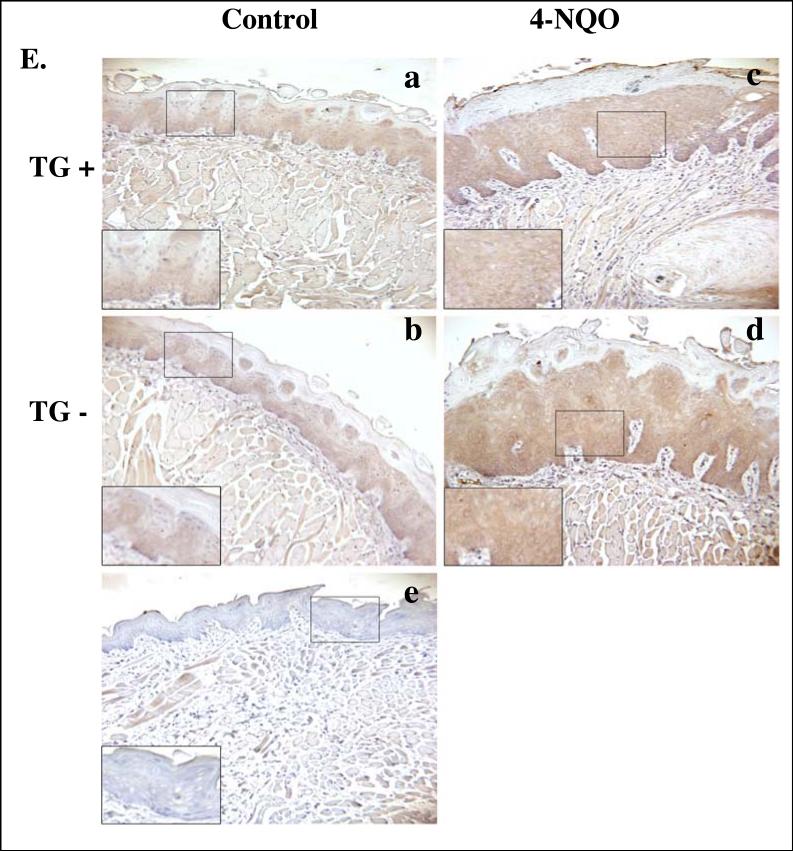
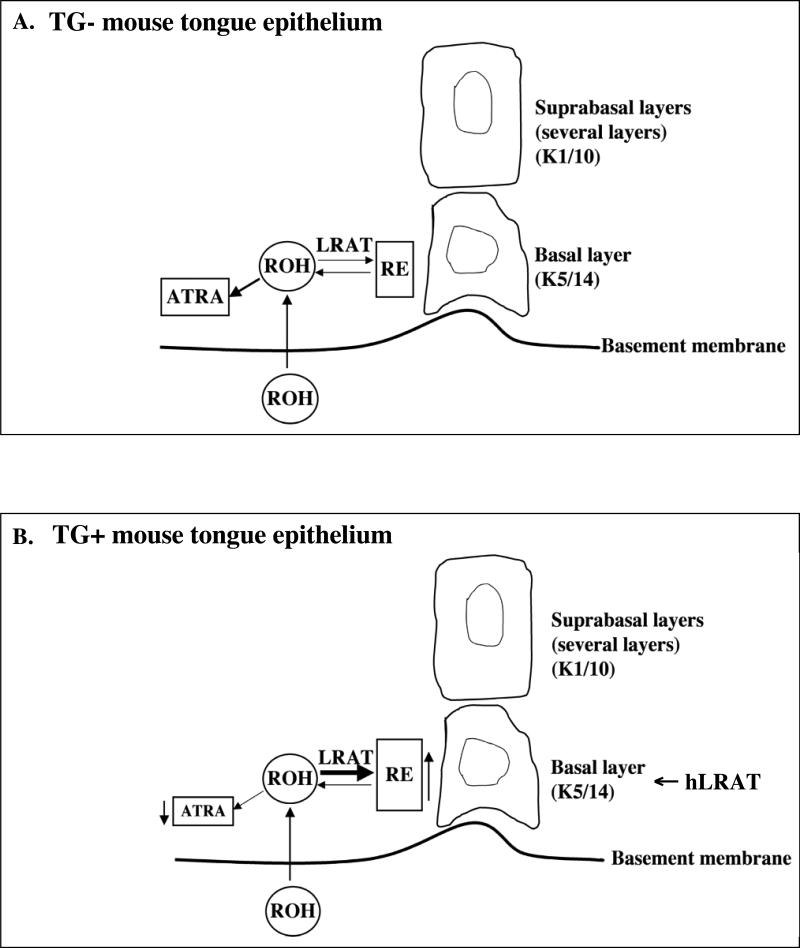
Lecithin:retinol acyltransferase (LRAT) is an enzyme that converts retinol (vitamin A) to retinyl esters. Its expression is often reduced in human cancers, including oral cavity cancers. We investigated the effects of ectopic expression of human lecithin:retinol acyltransferase (LRAT) on murine oral cavity carcinogenesis induced by the carcinogen 4-nitroquinoline 1-oxide (4-NQO). We targeted human LRAT expression specifically to the basal layer of mouse skin and oral cavity epithelia by using a portion of the human cytokeratin 14 (K14) promoter. High levels of human LRAT transgene transcripts were detected in the tongues and skin of adult transgenic positive (TG+) mice, but not in transgenic negative (TG-) mice. The retinyl ester levels in skin of LRAT TG+ mice were 32% +/- 5.4% greater than those in TG- mice, and topical treatment of the back skin with retinol resulted in greater increases in retinyl esters (from 6.9- to 14.3-fold in different TG+ mice) in TG+ mouse skin than in TG- mouse skin (1.3 fold). While carcinogen (4-NQO) treatment induced multifocal precancerous and cancer lesions in the tongues of both TG positive (n=16) and negative mice (n=22), higher percentages of transgenic positive mice (62.5%) developed more severe tongue lesions (grades 3 and 4) than transgenic negative mice (24.8%) after 4-NQO treatment (p < 0.05). Carcinogen treatment also resulted in greater percentages of transgenic positive mouse tongues with hyperplasia (71.4%), dysplasia (85.7%, p < 0.05), and carcinoma (28.6%) than transgenic negative mouse tongues (53.3%, 46.7%, and 20%, respectively). Moreover, we observed higher cyclooxygenase-2 (Cox-2) and lower RARbeta(2) mRNA levels in TG+ mouse tongues as compared to TG- mouse tongues after 4-NQO treatment (p < 0.05). Taken together, these data show that overexpression of human LRAT specifically in oral basal epithelial cells makes these cells more sensitive to carcinogen induced tumorigenesis.


Figures

Figure 1
Figure 1. Targeted overexpression of the transgene FLAG-hLRAT to the mouse epithelial basal layer cells
A, The schematic structure of the transgene cassette. B, Southern blot result shows the presence of the transgene in the mouse genomic DNA. C, RT-PCR analysis of the FLAG-hLRAT transgene mRNA in the tongue and skin of K14/FLAG-hLRAT Southern blot transgenic positive (TG+) and negative (TG-) mice from founder #54. D, The expression of the transgene human LRAT protein in the tongue epithelial basal layer cells of K14/FLAG-hLRAT transgenic positive (TG+) and negative (TG-) mice from founder #54 (200 ×). K14/FLAG-hLRAT TG+ and TG- mice were sacrificed, and the tongues were fixed, embedded, sectioned, and stained with anti-human LRAT antibody (see “Materials and Methods”). a, TG positive mouse tongue; b, TG negative mouse tongue; c, negative control, tongue stained only with a secondary antibody; the inset in each picture is 3 × the digital magnification of the small boxed area in the picture. E, the levels of retinyl esters in the skin of K14/FLAG-hLRAT TG positive and negative mice examined by HPLC after a 5 day topical treatment with 40 nmoles (volume 400 μl) of all-trans retinoic acid (ATRA) or retinol per day. Drugs were dissolved in acetone that was the vehicle (see “Materials and Methods”). TG+ #33 and #54 are two TG positive founder lines. The differences among different treatment groups were analyzed by using a one way ANOVA test. Differences with a p value of < 0.05 (marked with an asterisk) in a comparison of retinyl ester levels in retinol treated TG+ mouse skin to that in retinol treated TG- mouse skin were considered to be statistically significant.
Figure 2
Figure 2. 4-NQO carcinogen treatment of K14/FLAG-hLRAT TG positive and negative mouse tongues
K14/FLAG-hLRAT TG positive and negative mice were treated with 4-NQO (100 μg/ml) in the drinking water (see “Materials and Methods”) for 10 weeks and then maintained for another 15 weeks. A, a brief diagram of the experimental protocol. B, representative gross morphological observations of the mouse tongues and the gross tongue lesions grading system (10 ×). C, the grading of tongue lesions in K14/FLAG-hLRAT TG positive and negative control (not treated with carcinogen) mice. D, the grading of tongue lesions in K14/FLAG-hLRAT TG positive and negative mice treated with 4-NQO. The data (percentages in different grades) were analyzed by using a Fisher's exact probability test. Differences with a p value of < 0.05 (marked with an asterisk) between TG+ and TG- mouse tongue lesion grades were considered to be statistically significant.
Figure 3
Figure 3. Pathological evidence of carcinogenesis in mouse tongues after carcinogen treatment
K14/FLAG-hLRAT TG positive and negative mice were treated with 4-NQO (100 μg/ml) in drinking water (see “Materials and Methods”) for 10 weeks and then maintained for another 15 weeks. The mice were sacrificed, and the tongues were fixed, embedded, sectioned, and stained with H&E. A, representative pictures of pathology (200 ×): a, hyperplasia with marked hyperkeratosis; b, mild dysplasia; c, severe dysplasia / carcinoma in situ; d, invasive carcinoma with tumor cells invading the skeletal muscle fibers of the tongue. B, Percentage of mouse tongue samples (each sample was from a different mouse) at different carcinogenesis stages. The data were analyzed by using a Fisher's exact probability test. Differences with a p value of < 0.05 (marked with an asterisk) were considered to be statistically significant.
Figure 4
Figure 4. Cox-2 and RARβ2 mRNA levels in control (not treated with 4-NQO) and 4-NQO treated mouse tongues
K14/FLAG-hLRAT TG positive and negative mice were treated with propylene glycol (vehicle) or 4-NQO (100 μg/ml) in drinking water (see “Materials and Methods”) for 10 weeks and then maintained for another 15 weeks. Total RNA was extracted from mouse tongues and specific mRNA levels were measured by real time RT-PCR. A, Cox-2 mRNA. B, RARβ2 mRNA. The data were analyzed by using a Wilcoxon rank sum test. Differences of mRNA levels between TG+ and TG- mouse tongues with a p value of < 0.05 (marked with an asterisk) were considered to be statistically significant.
Figure 5
Figure 5. Expression of hLRAT, PCNA, p16, cyclin D1, and phospho-Akt (ser 473) proteins in control (not treated with 4-NQO) and 4-NQO treated mouse tongues
K14/FLAG-hLRAT TG positive and negative mice were treated with propylene glycol (vehicle) or 4-NQO (100 μg/ml) in drinking water for 10 weeks and then maintained for another 15 weeks. Mice were sacrificed, and the tongues were fixed, embedded, sectioned, and stained with anti-hLRAT, anti-PCNA, anti-p16, anti-cyclin D1, and anti-phospho-Akt (Ser 473) antibodies, respectively (see “Materials and Methods”) (200 ×). A, hLRAT staining of 4-NQO treated mouse tongues (a and b TG+; c, TG-; a and c, before tumor appears; b, tumor). B, PCNA staining of mouse tongues. C, p16 staining of mouse tongues. D, cyclin D1 staining of mouse tongues. E, phospho-Akt (Ser 473) staining of mouse tongues. In panels B to E: a and c, TG positive mouse tongues; b and d, TG negative mouse tongues. a and b, control (not treated with 4-NQO) mouse tongues; c and d, 4-NQO treated mouse tongues. e, negative control, a mouse tongue stained only with a secondary antibody. The inset in each picture is 3 × the digital magnification of the small boxed area in the picture.
Figure 6
Figure 6. Model of retinoid actions in K14/FLAG-hLRAT transgenic negative and positive mouse tongue epithelia
A, transgenic negative mouse tongue epithelium. B, transgenic positive mouse tongue epithelium. The thicker arrow under LRAT indicates a greater expression level of LRAT. ATRA, all-trans retinoic acid; RE, retinyl esters; ROH, retinol; TG-, transgenic negative; TG+, transgenic positive.

Comment in

Similar articles

Cited by

References

    1. Alessi DR, Andjelkovic M, Caudwell B, Cron P, Morrice N, Cohen P, Hemmings BA. Mechanism of activation of protein kinase B by insulin and IGF-1. Embo J. 1996;15:6541–51. - PMC - PubMed
    1. Amornphimoltham P, Sriuranpong V, Patel V, Benavides F, Conti CJ, Sauk J, Sausville EA, Molinolo AA, Gutkind JS. Persistent activation of the Akt pathway in head and neck squamous cell carcinoma: a potential target for UCN-01. Clin Cancer Res. 2004;10:4029–37. - PubMed
    1. Argiris A, Karamouzis MV, Raben D, Ferris RL. Head and neck cancer. Lancet. 2008;371:1695–709. - PMC - PubMed
    1. Arnold I, Watt FM. c-Myc activation in transgenic mouse epidermis results in mobilization of stem cells and differentiation of their progeny. Curr Biol. 2001;11:558–568. - PubMed
    1. Binnie WH, Rankin KV, Mackenzie IC. Etiology of oral squamous cell carcinoma. J Oral Pathol. 1983;12:11–29. - PubMed

Publication types

MeSH terms