

Application of immunoaffinity capillary electrophoresis to the measurements of secreted cytokines by cultured astrocytes
- PMID: 19472286
- PMCID: PMC2756027
- DOI: 10.1002/jssc.200900047
Application of immunoaffinity capillary electrophoresis to the measurements of secreted cytokines by cultured astrocytes
Abstract
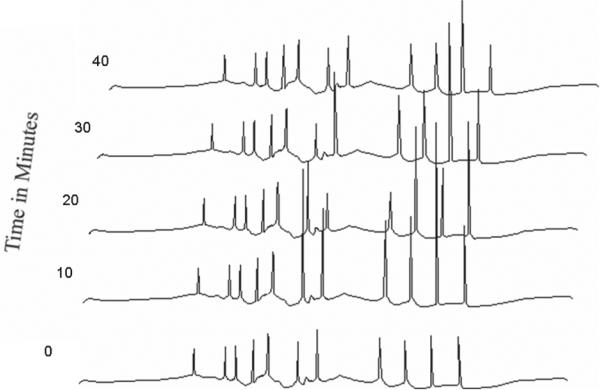
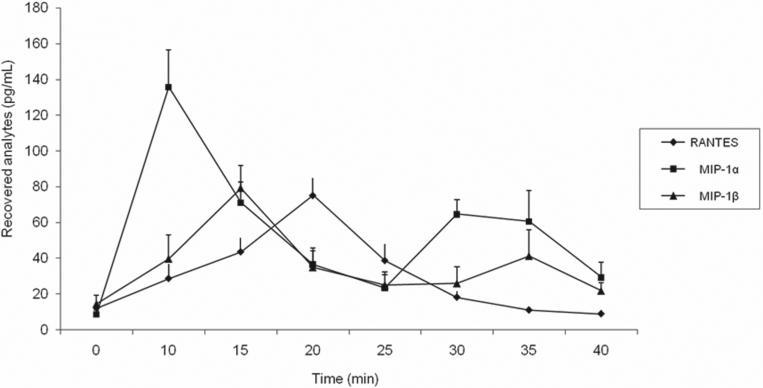
The ability of the central nervous system (CNS) to act in conjunction with the immune system has been of great interest to both neurobiologists and immunologists. Previous studies have shown that astrocytes can be stimulated, by various peptides, to act as immune regulators within the CNS and release cytokines and chemokines. However, the regulatory mechanism of astrocytes is still poorly understood. Our present study describes a micro-device capable of monitoring the growth and stimulation of 20 astrocytes by vasoactive intestinal peptide. A microdialysis needle was used to collect the secretion by products, which were analyzed by immunoaffinity capillary electrophoresis (ICE) for the secretion of pro-inflammatory cytokines, IL-1alpha, IL-1beta, IL-6, and tumor necrosis factor (TNF)-alpha; hemopoietic cytokines, IL-3, granulocyte colony-stimulating factor (G-CSF), macrophage colony-stimulating factor (M-CSF), granulocyte/macrophage colony-stimulating factor (GM-CSF); and chemokines; regulated upon activation normal T-cell expression sequence (RANTES), macrophage inflammatory protein (MIP)-1alpha and MIP-1beta. Vasoactive intestinal peptide stimulated astrocytes showed an almost immediate release of pro-inflammatory cytokines and chemokines, with an increase over baseline ranging from 3 to 15 fold, while no substantial increase over baseline was observed for hemopoietic cytokines. This system demonstrates the ability to isolate individual cells in a closely controlled environment and identify and quantify their analytes.
Figures


References
-
- Brenneman DE. Peptides. 2007;28:1720–1726. - PubMed
-
- Yadav M, Goetzl EJ. Ann. N. Y. Acad. Sci. 2008;1144:83–89. - PubMed
-
- Bailey SL, Carpentier PA, McMahon EJ, Begolka WS, Miller SD. Crit. Rev. Immunol. 2006;26:149–188. - PubMed
-
- Brenneman DE, Hauser J, Spong CY, Phillips TM. Ann. N. Y. Acad. Sci. 2000;921:109–114. - PubMed
-
- Brenneman DE, Hill JM, Gozes I, Phillips TM. Ann. N. Y. Acad. Sci. 1996;805:280–287. discussion 287 – 289. - PubMed
Publication types
MeSH terms
Substances
Grants and funding
LinkOut - more resources
Full Text Sources
Research Materials
