

pH measurement as quality control on human post mortem brain tissue: a study of the BrainNet Europe consortium
- PMID: 19473297
- PMCID: PMC4532399
- DOI: 10.1111/j.1365-2990.2008.01003a.x
pH measurement as quality control on human post mortem brain tissue: a study of the BrainNet Europe consortium
Abstract
Aims: Most brain diseases are complex entities. Although animal models or cell culture experiments mimic some disease aspects, human post mortem brain tissue remains essential to advance our understanding of brain diseases using biochemical and molecular techniques. Post mortem artefacts must be properly understood, standardized, and either eliminated or factored into such experiments. Here we examine the influence of several premortem and post mortem factors on pH, and discuss the role of pH as a biochemical marker for brain tissue quality.
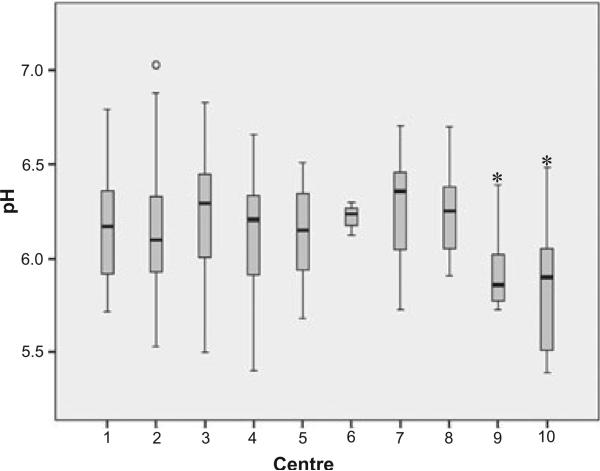
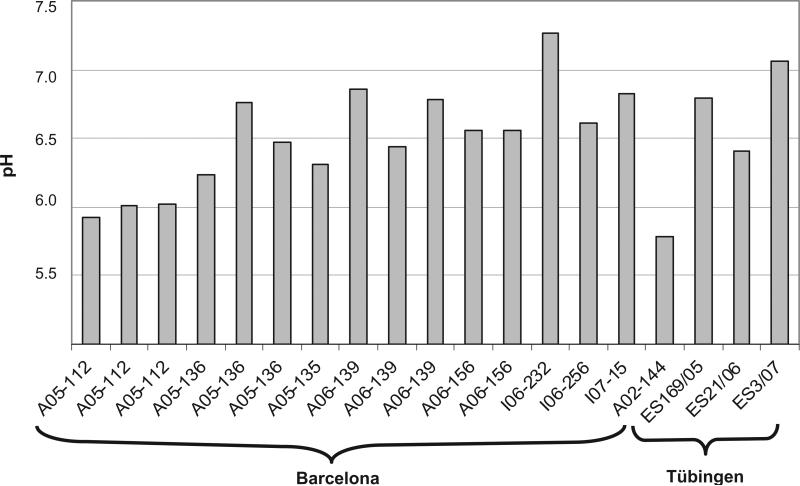
Methods: We assessed brain tissue pH in 339 samples from 116 brains provided by 8 different European and 2 Australian brain bank centres. We correlated brain pH with tissue source, post mortem delay, age, gender, freezing method, storage duration, agonal state and brain ischaemia.
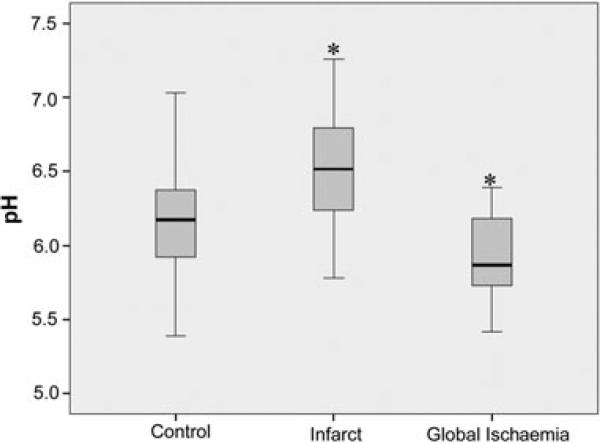
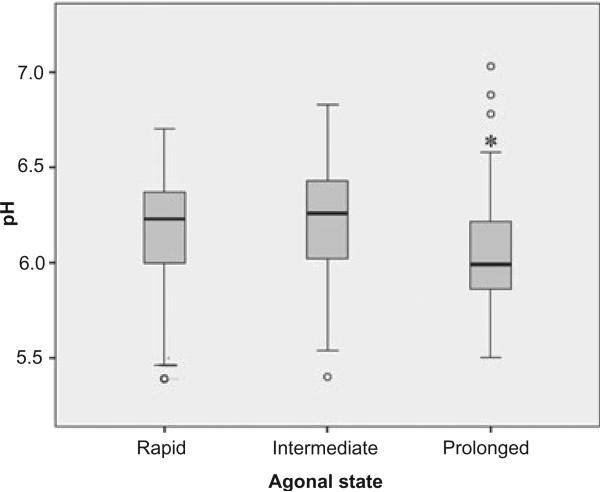
Results: Our results revealed that only prolonged agonal state and ischaemic brain damage influenced brain tissue pH next to repeated freeze/thaw cycles.
Conclusions: pH measurement in brain tissue is a good indicator of premortem events in brain tissue and it signals limitations for post mortem investigations.
Figures


References
-
- Johnston NL, Cervenak J, Shore AD, Torrey EF, Yolken RH. Multivariate analysis of RNA levels from postmortem human brains as measured by three different methods of RT-PCR. Stanley Neuropathology Consortium. J Neurosci Methods. 1997;77:83–92. - PubMed
-
- Spokes EG, Garrett NJ, Iversen LL. Differential effects of agonal status on measurements of GABA and glutamate decarboxylase in human post-mortem brain tissue from control and Huntington's chorea subjects. J Neurochem. 1979;33:773–8. - PubMed
-
- Alafuzoff I, Winblad B. How to run a brain bank: potentials and pitfalls in the use of human post-mortem brain material in research. J Neural Transm Suppl. 1993;39:235–43. - PubMed
-
- Ravid R, Van Zwieten EJ, Swaab DF. Brain banking and the human hypothalamus-factors to match for, pitfalls and potentials. Prog Brain Res. 1992;93:83–95. - PubMed
-
- Hardy JA, Wester P, Winblad B, Gezelius C, Bring G, Eriksson A. The patients dying after long terminal phase have acidotic brains; implications for biochemical measurements on autopsy tissue. J Neural Transm. 1985;61:253–64. - PubMed
Publication types
MeSH terms
Grants and funding
LinkOut - more resources
Full Text Sources
Miscellaneous
