

Combining the receptor tyrosine kinase inhibitor AEE788 and the mammalian target of rapamycin (mTOR) inhibitor RAD001 strongly inhibits adhesion and growth of renal cell carcinoma cells
- PMID: 19473483
- PMCID: PMC2693528
- DOI: 10.1186/1471-2407-9-161
Combining the receptor tyrosine kinase inhibitor AEE788 and the mammalian target of rapamycin (mTOR) inhibitor RAD001 strongly inhibits adhesion and growth of renal cell carcinoma cells
Abstract
Background: Treatment options for metastatic renal cell carcinoma (RCC) are limited due to resistance to chemo- and radiotherapy. The development of small-molecule multikinase inhibitors has now opened novel treatment options. We evaluated the influence of the receptor tyrosine kinase inhibitor AEE788, applied alone or combined with the mammalian target of rapamycin (mTOR) inhibitor RAD001, on RCC cell adhesion and proliferation in vitro.
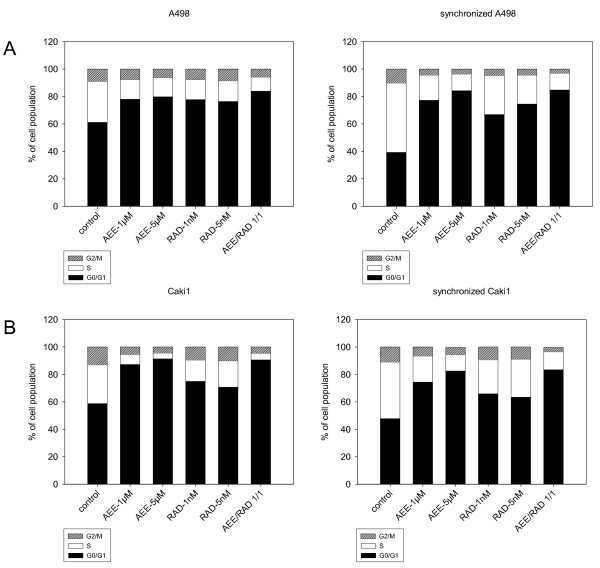
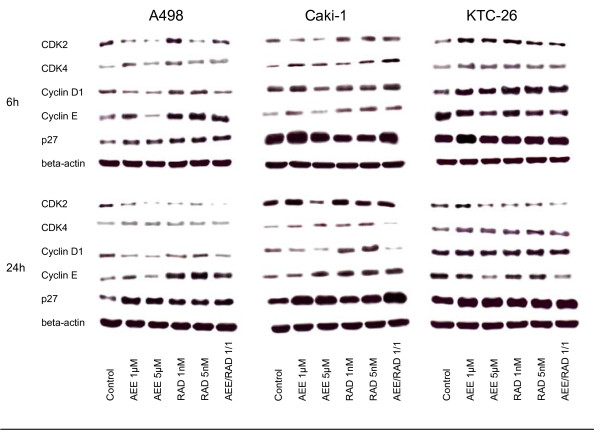
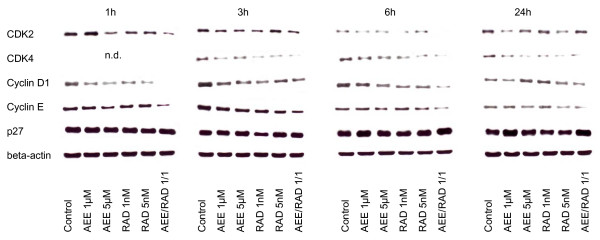
Methods: RCC cell lines Caki-1, KTC-26 or A498 were treated with various concentrations of RAD001 or AEE788 and tumor cell proliferation, tumor cell adhesion to vascular endothelial cells or to immobilized extracellular matrix proteins (laminin, collagen, fibronectin) evaluated. The anti-tumoral potential of RAD001 combined with AEE788 was also investigated. Both, asynchronous and synchronized cell cultures were used to subsequently analyze drug induced cell cycle manipulation. Analysis of cell cycle regulating proteins was done by western blotting.
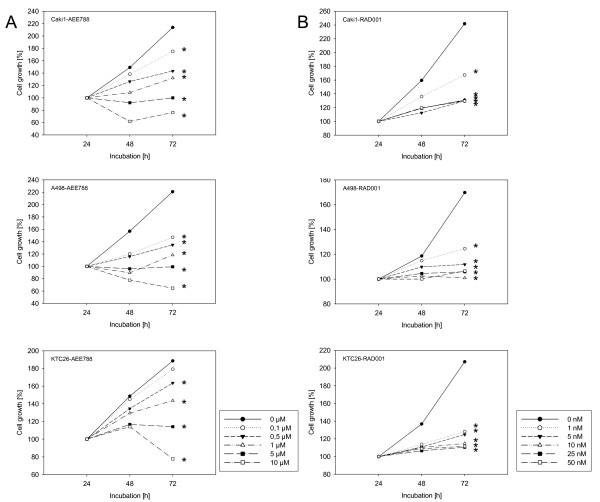
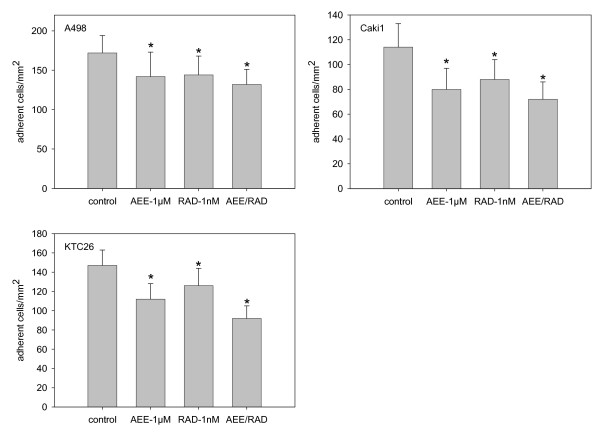
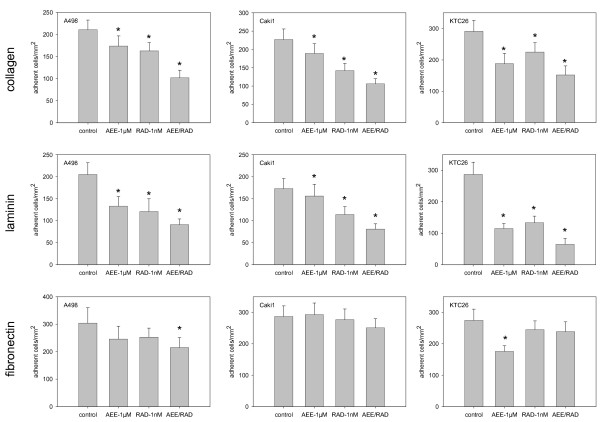
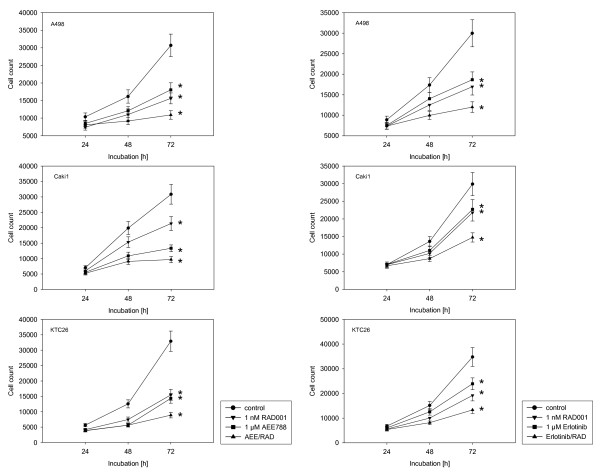
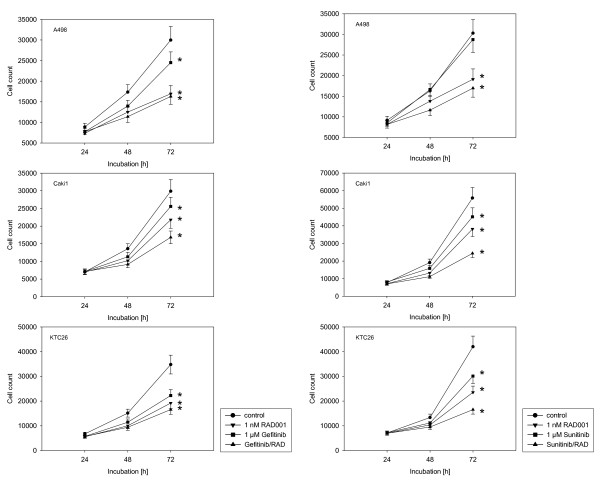
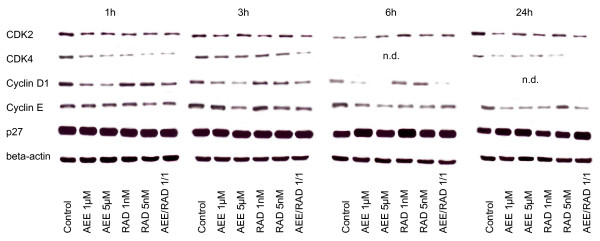
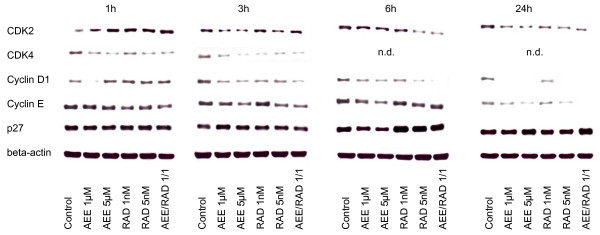
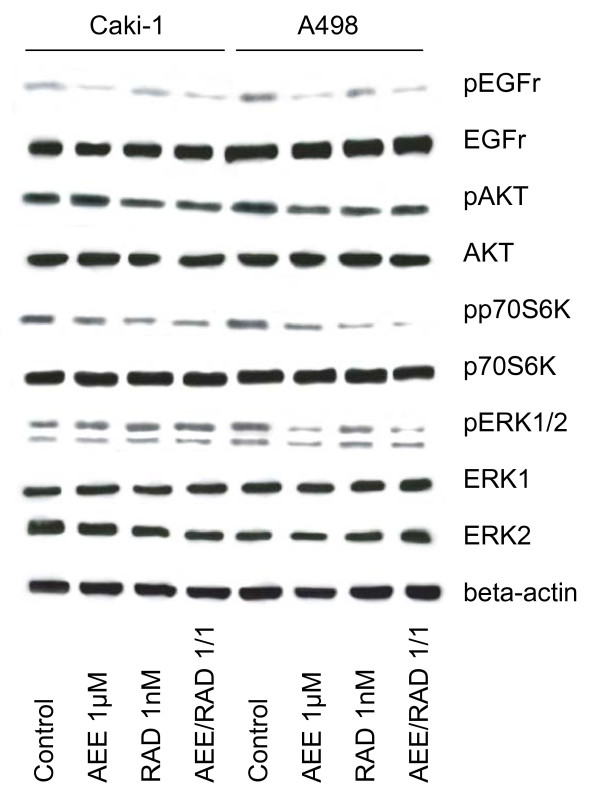
Results: RAD001 or AEE788 reduced adhesion of RCC cell lines to vascular endothelium and diminished RCC cell binding to immobilized laminin or collagen. Both drugs blocked RCC cell growth, impaired cell cycle progression and altered the expression level of the cell cycle regulating proteins cdk2, cdk4, cyclin D1, cyclin E and p27. The combination of AEE788 and RAD001 resulted in more pronounced RCC growth inhibition, greater rates of G0/G1 cells and lower rates of S-phase cells than either agent alone. Cell cycle proteins were much more strongly altered when both drugs were used in combination than with single drug application. The synergistic effects were observed in an asynchronous cell culture model, but were more pronounced in synchronous RCC cell cultures.
Conclusion: Potent anti-tumoral activitites of the multikinase inhibitors AEE788 or RAD001 have been demonstrated. Most importantly, the simultaneous use of both AEE788 and RAD001 offered a distinct combinatorial benefit and thus may provide a therapeutic advantage over either agent employed as a monotherapy for RCC treatment.
Figures
Similar articles
-
Molecular targeting of prostate cancer cells by a triple drug combination down-regulates integrin driven adhesion processes, delays cell cycle progression and interferes with the cdk-cyclin axis.BMC Cancer. 2011 Aug 25;11:375. doi: 10.1186/1471-2407-11-375. BMC Cancer. 2011. PMID: 21867506 Free PMC article.
-
Critical analysis of simultaneous blockage of histone deacetylase and multiple receptor tyrosine kinase in the treatment of prostate cancer.Prostate. 2011 May 15;71(7):722-35. doi: 10.1002/pros.21288. Epub 2010 Oct 15. Prostate. 2011. PMID: 20954195
-
The combination of multiple receptor tyrosine kinase inhibitor and mammalian target of rapamycin inhibitor overcomes erlotinib resistance in lung cancer cell lines through c-Met inhibition.Mol Cancer Res. 2010 Aug;8(8):1142-51. doi: 10.1158/1541-7786.MCR-09-0388. Epub 2010 Jul 20. Mol Cancer Res. 2010. PMID: 20647329
-
Everolimus for the treatment of advanced renal cell carcinoma.Expert Opin Pharmacother. 2011 May;12(7):1143-55. doi: 10.1517/14656566.2011.571382. Epub 2011 Apr 7. Expert Opin Pharmacother. 2011. PMID: 21470068 Review.
-
Everolimus in the treatment of renal cell carcinoma and neuroendocrine tumors.Adv Ther. 2010 Aug;27(8):495-511. doi: 10.1007/s12325-010-0045-2. Epub 2010 Jul 8. Adv Ther. 2010. PMID: 20623346 Review.
Cited by
-
Multi-targeted kinase inhibition alleviates mTOR inhibitor resistance in triple-negative breast cancer.Breast Cancer Res Treat. 2019 Nov;178(2):263-274. doi: 10.1007/s10549-019-05380-z. Epub 2019 Aug 6. Breast Cancer Res Treat. 2019. PMID: 31388935 Free PMC article.
-
Molecular analysis of sunitinib resistant renal cell carcinoma cells after sequential treatment with RAD001 (everolimus) or sorafenib.J Cell Mol Med. 2015 Feb;19(2):430-41. doi: 10.1111/jcmm.12471. Epub 2014 Dec 2. J Cell Mol Med. 2015. PMID: 25444514 Free PMC article.
-
Targeting the non-canonical roles of PCNA modifies and increases the response to targeted anti-cancer therapy.Oncotarget. 2019 Dec 31;10(68):7185-7197. doi: 10.18632/oncotarget.27267. eCollection 2019 Dec 31. Oncotarget. 2019. PMID: 31921382 Free PMC article.
-
An mTOR and VEGFR inhibitor combination arrests a doxorubicin resistant lung metastatic osteosarcoma in a PDOX mouse model.Sci Rep. 2021 Apr 21;11(1):8583. doi: 10.1038/s41598-021-87553-9. Sci Rep. 2021. PMID: 33883561 Free PMC article.
-
Phase I combination of pazopanib and everolimus in PIK3CA mutation positive/PTEN loss patients with advanced solid tumors refractory to standard therapy.Invest New Drugs. 2015 Jun;33(3):700-9. doi: 10.1007/s10637-015-0238-2. Epub 2015 Apr 24. Invest New Drugs. 2015. PMID: 25902899 Clinical Trial.
References
-
- Escudier B, Eisen T, Stadler WM, Szczylik C, Oudard S, Siebels M, Negrier S, Chevreau C, Solska E, Desai AA, Rolland F, Demkow T, Hutson TE, Gore M, Freeman S, Schwartz B, Shan M, Simantov R, Bukowski RM. TARGET Study Group. Sorafenib in advanced clear-cell renal-cell carcinoma. N Engl J Med. 2007;356:125–34. doi: 10.1056/NEJMoa060655. - DOI - PubMed
-
- Ravaud A, Hawkins R, Gardner JP, Maase H von der, Zantl N, Harper P, Rolland F, Audhuy B, Machiels JP, Pétavy F, Gore M, Schöffski P, El-Hariry I. Lapatinib versus hormone therapy in patients with advanced renal cell carcinoma: a randomized phase III clinical trial. J Clin Oncol. 2008;26:2285–91. doi: 10.1200/JCO.2007.14.5029. - DOI - PubMed
-
- Jermann M, Stahel RA, Salzberg M, Cerny T, Joerger M, Gillessen S, Morant R, Egli F, Rhyner K, Bauer JA, Pless M. A phase II, open-label study of gefitinib (IRESSA) in patients with locally advanced, metastatic, or relapsed renal-cell carcinoma. Cancer Chemother Pharmacol. 2006;57:533–9. doi: 10.1007/s00280-005-0070-z. - DOI - PubMed
Publication types
MeSH terms
Substances
LinkOut - more resources
Full Text Sources
Other Literature Sources
Research Materials
Miscellaneous
