

Genetic analysis of an F(2) intercross between two chicken lines divergently selected for body-weight
- PMID: 19473501
- PMCID: PMC2695486
- DOI: 10.1186/1471-2164-10-248
Genetic analysis of an F(2) intercross between two chicken lines divergently selected for body-weight
Abstract
Background: We have performed Quantitative Trait Loci (QTL) analysis of an F(2) intercross between two chicken lines divergently selected for juvenile body-weight. In a previous study 13 identified loci with effects on body-weight, only explained a small proportion of the large variation in the F(2) population. Epistatic interaction analysis however, indicated that a network of interacting loci with large effect contributed to the difference in body-weight of the parental lines. This previous analysis was, however, based on a sparse microsatellite linkage map and the limited coverage could have affected the main conclusions. Here we present a revised QTL analysis based on a high-density linkage map that provided a more complete coverage of the chicken genome. Furthermore, we utilized genotype data from ~13,000 SNPs to search the genome for potential selective sweeps that have occurred in the selected lines.
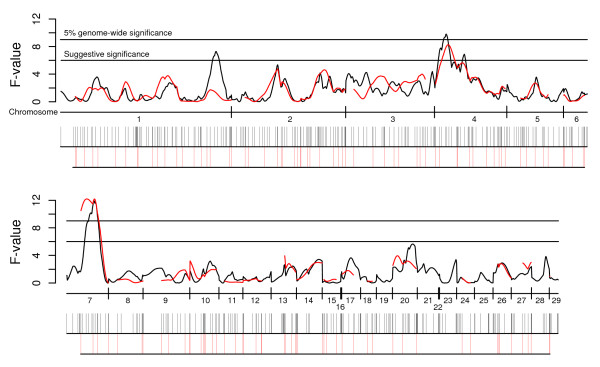
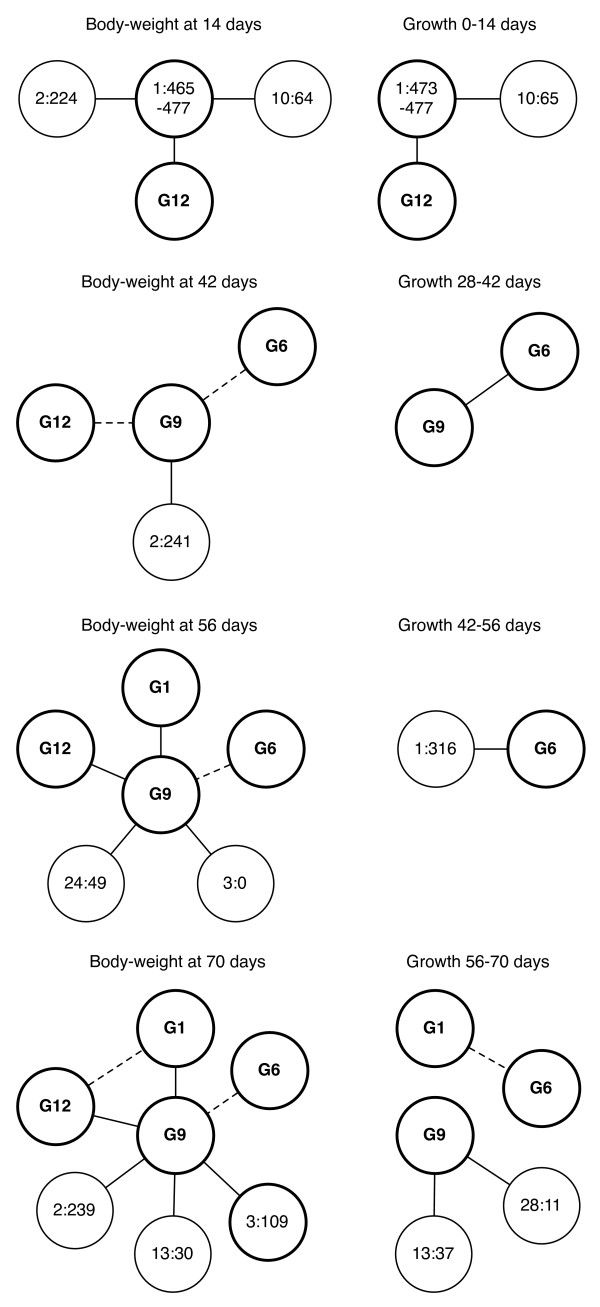
Results: We constructed a linkage map comprising 434 genetic markers, covering 31 chromosomes but leaving seven microchromosomes uncovered. The analysis showed that seven regions harbor QTL that influence growth. The pair-wise interaction analysis identified 15 unique QTL pairs and notable is that nine of those involved interactions with a locus on chromosome 7, forming a network of interacting loci. The analysis of ~13,000 SNPs showed that a substantial proportion of the genetic variation present in the founder population has been lost in either of the two selected lines since ~60% of the SNPs polymorphic among lines showed fixation in one of the lines. With the current marker coverage and QTL map resolution we did not observe clear signs of selective sweeps within QTL intervals.
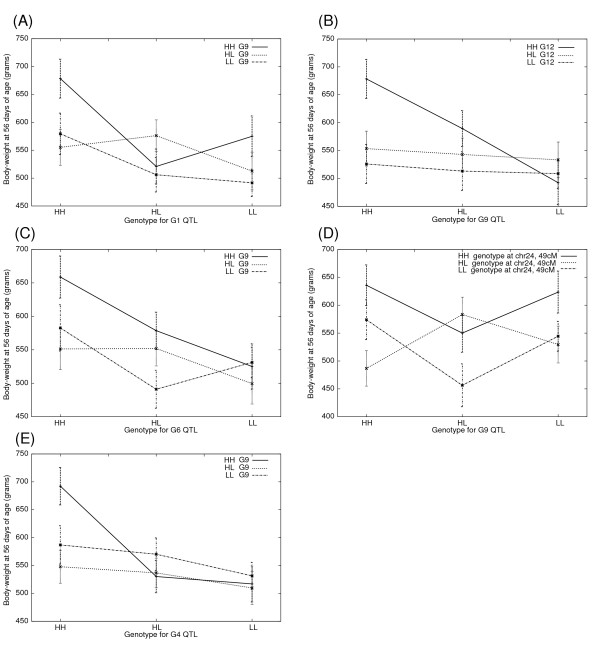
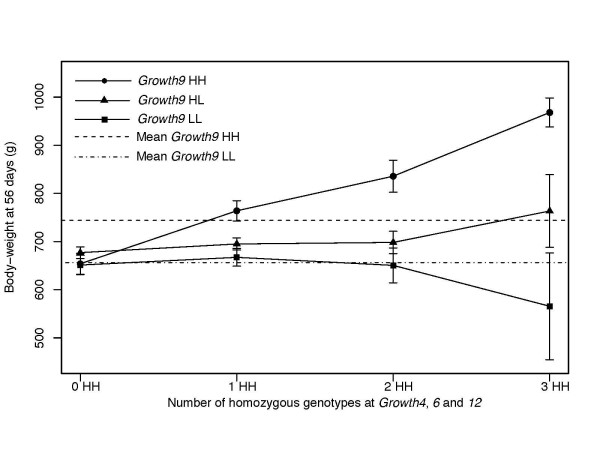
Conclusion: The results from the QTL analysis using the new improved linkage map are to a large extent in concordance with our previous analysis of this pedigree. The difference in body-weight between the parental chicken lines is caused by many QTL each with a small individual effect. Although the increased chromosomal marker coverage did not lead to the identification of additional QTL, we were able to refine the localization of QTL. The importance of epistatic interaction as a mechanism contributing significantly to the remarkable selection response was further strengthened because additional pairs of interacting loci were detected with the improved map.
Figures
References
-
- Dunnington EA, Siegel PB. Long-term divergent selection for eight-week body weight in white Plymouth rock chickens. Poult Sci. 1996;75:1168–1179. - PubMed
-
- Wahlberg P, Stromstedt L, Tordoir X, Foglio M, Heath S, Lechner D, Hellstrom AR, Tixier-Boichard M, Lathrop M, Gut IG, et al. A high-resolution linkage map for the Z chromosome in chicken reveals hot spots for recombination. Cytogenet Genome Res. 2007;117:22–29. doi: 10.1159/000103161. - DOI - PubMed
Publication types
MeSH terms
Substances
LinkOut - more resources
Full Text Sources
Medical
Miscellaneous
