. 2009 Aug 7;284(32):21589-98.
doi: 10.1074/jbc.M109.015040. Epub 2009 May 27.

Bovine and mouse SLO3 K+ channels: evolutionary divergence points to an RCK1 region of critical function

Affiliations

Bovine and mouse SLO3 K+ channels: evolutionary divergence points to an RCK1 region of critical function

Celia M Santi et al. J Biol Chem. .

Abstract

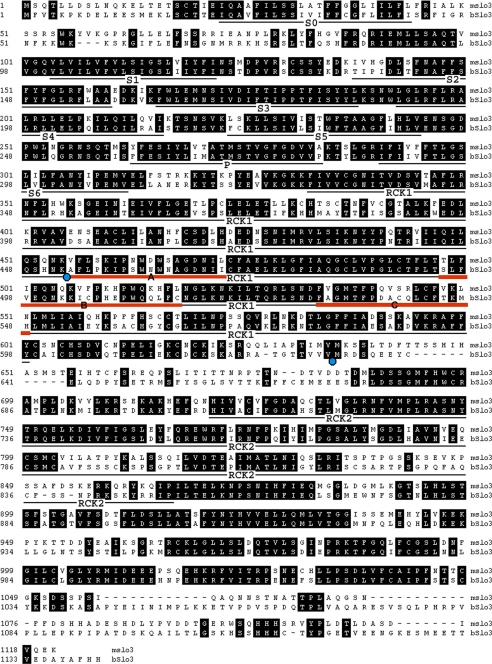
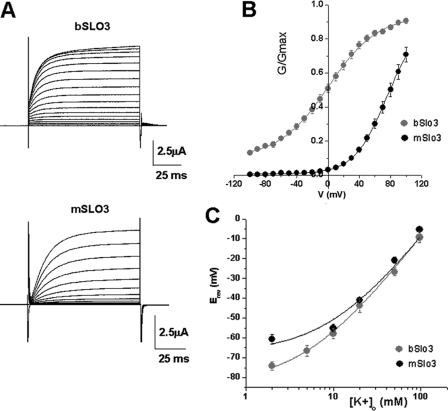
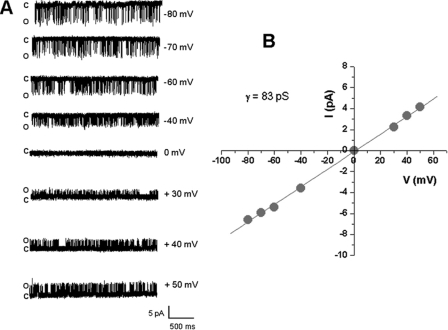
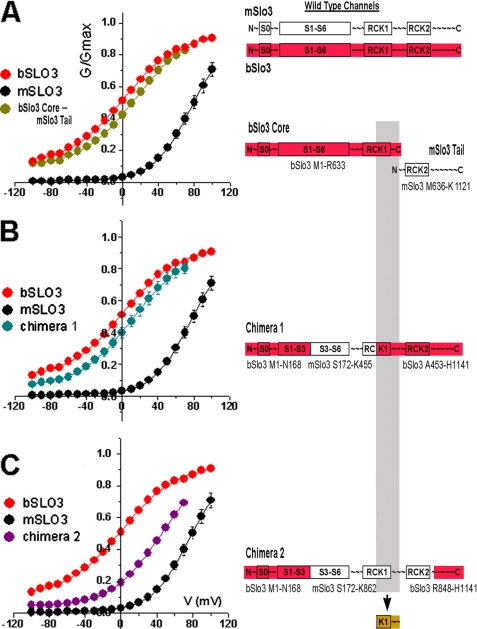
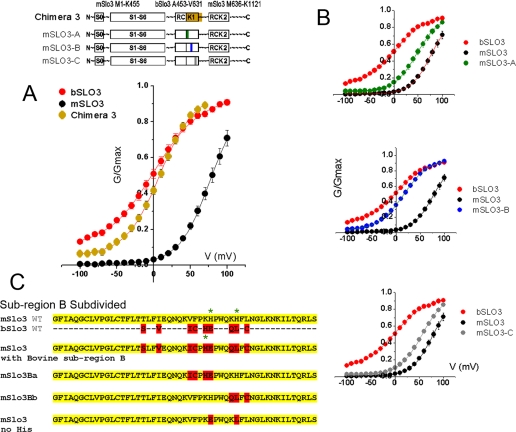
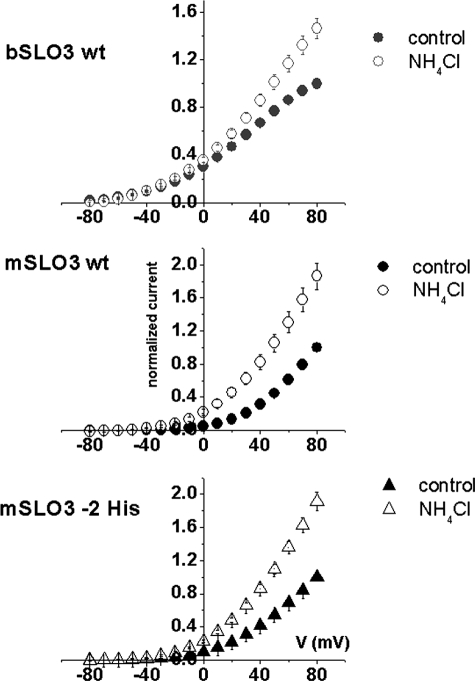
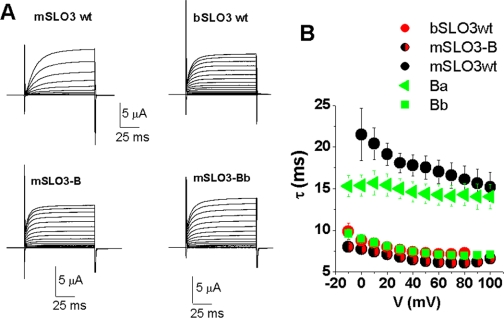
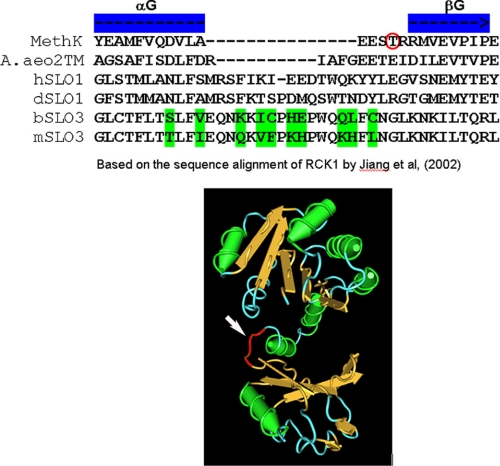
The slo3 gene encodes a K(+) channel found only in mammalian testis. This is in contrast to slo1, which is expressed in many tissues. Genes pertaining to male reproduction, especially those involved in sperm production, evolve morphologically and functionally much faster than their nonsexual counterparts. A comparison of SLO3 channel amino acid sequences from several species revealed a high degree of structural divergence relative to their SLO1 channel paralogues. To reveal any biophysical differences accompanying this rapid structural divergence, we analyzed the functional properties of SLO3 channels from two species, bovine and mouse. We observed several functional differences including voltage range of activation, kinetics, and pH sensitivity. Although SLO3 channel proteins from these two species lack conservation in many structural regions, we found that the first two of these three functional differences map to the same loop structure in their RCK1 (regulator of K(+) conductance 1) domain, which links the intermediate RCK1 subdomain to the C-terminal subdomain. We found that small structural changes in this region produce major changes in the voltage range of activation and kinetics. This rapidly evolving loop peptide shows the greatest length and sequence polymorphisms within RCK1 domains from many different species. In SLO3 channels this region may permit evolutionary changes that tune the gating properties in different species.


Figures

FIGURE 1.
FIGURE 1.
Interspecies (bovine-mouse) alignment of the amino acid sequences of SLO3 channel paralogues. Identical residues are shaded. A comparison of Fig. 1 and supplemental Fig. S1 reveals that SLO3 paralogues are highly divergent (62.1% identity) relative to SLO1 paralogues (98.2% identity) in the same species, suggesting a more rapid rate of evolution. Unusually rapid evolutionary change is characteristic of genes involved in sexual reproduction and especially in male reproduction. Hydrophobic segments surrounding the pore region are designated S0–S6. The limits of the bSLO3 sequence incorporated into chimera 3 are indicated by filled blue circles. The mSLO3-A, mSLO3-B, and mSLO3-C chimeric regions are indicated by red bars designated A, B, and C, respectively (see text). SLO3 and SLO1 channels have similar voltage sensors (underline S4) (15). The “calcium bowl” Ca2+-sensing site (16) present in SLO1 is not present in SLO3.
FIGURE 2.
FIGURE 2.
bSLO3 channels activate at more negative potentials than mSLO3 channels and are less voltage-dependent. A, families of whole cell currents from bSLO3 and mSLO3 channels expressed in Xenopus oocytes evoked by voltage steps from −90 to +100 mV in 10-mV steps at Vh = −70 mV. B, G-V relationships for bSLO3 and mSLO3 currents. bSLO3 channels activate at more negative potentials, and the currents have a more shallow conductance-voltage relation than mSLO3. Note that there is significant bSLO3 conductance at −100 mV. The data were fitted with the Boltzmann equation (see “Materials and Methods”) with V½ = 0.49 ± 2.1 mV, k = 31.7 ± 2.2 (n = 21) for bSLO3; and V½ = 77.1.6 ± 4.9, k = 21.2 ± 1.01 for mSLO3 (n = 9). C, reversal potentials (Erev) plotted at different external K+ concentrations to illustrate the relative selectivity for K+ over Na+ for bSLO3 and mSLO3 channels. Reversal potentials were obtained by measuring tail currents at different [K+]o. [Na+]o was also varied so that the total concentration of monovalent cations was 98 mm. The data were fitted with the Goldman-Hodgkin-Katz equation, Erev = RT/F*ln([K+]o + P*([Na+]o))/([K+]i + P*[Na+]i), where P is the Na+/K+ permeability ratio and varied freely. For bSLO3 reversal potentials were obtained at 2, 5, 10, 20, 50, and 97 mm [K+]o (n = 12, 8, 6, 7, 9, and 4, respectively), and the calculated pNa+/pK+ was 0.05. For mSLO3 reversal potentials were obtained at 2, 10, 20, 50, and 97 mm [K+]o (n = 8, 8, 2, 6, and 4, respectively), which yielded a pNa+/pK+of 0.1. Fits were performed using Sigmaplot (Jandel). Another indication that bSLO3 had higher selectivity for K+ over Na+ was the fact that the resting potentials of eggs injected with bSLO3 were more negative, e.g. −63.6 ± 2.1 mV (n = 16) versus −34.4 ± 2.7 mV (n = 9) for eggs injected with mSLO3.
FIGURE 3.
FIGURE 3.
bSLO3 channels are high conductance K+ channels and are active over a wide voltage range. A, analysis of single channel openings in inside-out patches showed channel openings over a broad voltage range (shown from −80 to +50 mV). This is consistent with our whole cell measurements of the bSLO3 conductance-voltage relation showing activity over a broad voltage range (Fig. 2). B, a plot of single channel amplitudes at different voltages yielded a bSLO3 channel conductance of 83 pS in symmetrical 140 mm K+.
FIGURE 4.
FIGURE 4.
The RCK1 region is important in determining the voltage range of activation of SLO3 channels. G-V curves from wild type bSLO3 and mSLO3 are compared with G-V curves for the following experimental constructs: A, co-expression of the bSLO3 core and mSLO3 tail. The G-V relation for this core and tail co-expression closely resembled that of wild type bSLO3 even though the tail containing RCK2 was from mSLO3. B, chimera 1 expression (bSLO3-based chimera containing the region of mSLO3 extending from S3 to the middle of RCK1) The G-V relation for this chimera also closely resembled that of wild type bSLO3. C, chimera 2 expression (same mSLO3 origin as chimera 1 but mSLO3 sequence extended through the entire RCK1 region). The G-V relation for this chimera was significantly shifted to more positive voltages. Each curve was fitted with a Boltzmann equation giving V½ values of +13 ± 3.8 mV (bSLO3 core-mSLO3 tail (n = 11)), +11.25 ± 4.8 mV (chimera 1 (n = 8)), and +44.0 ± 7.9 mV (chimera 2 (n = 11)) and k values of 29.9 ± 2.9, 29.4 ± 3.4, and 27.2 ± 2.4, respectively (means ± S.E.).
FIGURE 5.
FIGURE 5.
A small region in the distal part of the RCK1 domain has the most dramatic effect in changing the voltage range of activation of mSLO3 channels. A, G-V curve obtained from expression of chimera 3 compared with wild type G-V curves shows a G-V relation substantially shifted to negative values. Chimera 3 is a mSLO3-based construct containing only the distal half of RCK1 from bSLO3. Boltzmann fit of the chimera 3 G-V curve gave V½ and k values of +8.9 ± 1.98 mV and 23.97 ± 1.3 (n = 11), respectively. B, the small bSLO3 sequence in chimera 3 was subdivided and incorporated into three constructs, mSLO-A, mSLO3-B, and mSLO3-C. G-V relationships are shown for mSLO-A, mSLO3-B, and mSLO3-C chimeras. Their respective V½ parameters are 47 ± 3.15, 16.2 ± 1.42, and 56.1 ± 2.3 mV, and their respective k parameters are 23.5 ± 1.73, 26.5 ± 0.98, and 23.6 ± 0.91 (n = 12, 19, and 11) (means ± S.E.). The mSLO3-B G-V curve substantially resembled that of wild type bSLO3 with regard to its voltage parameters. C, subregion B was further subdivided. Using the mSLO3 wild type template, we incorporated four of the upstream residues of bovine subregion B to create mSLO3-Ba and three of the downstream bovine subregion B residues to create mSLO3-Bb. The respective V½ values of activation of these constructs are 42.4 ± 4.7 and 28.8 ± 1.5 mV, and the respective k values are 34.1 ± 2.5 and 30.2 ± 1.2 for mSLO3-Ba (n = 7) and mSLO3-Bb (n = 8). The sequence at the bottom shows the sequence of mSLO3 where two histidine residues have been replaced by the corresponding residues present in bSLO3. As shown in Fig. 6, the replacement of the histidine residues had no effect on the pH sensitivity of mSLO3 channels.
FIGURE 6.
FIGURE 6.
The removal of two histidine residues in mSLO3 subregion B does not affect pH sensitivity of mSLO3 channels. The I-V relationships are shown for: WT bSLO3 currents (top panel), WT mSLO3 currents (middle panel), and mSLO3−2 His mutant currents (bottom panel) in control conditions (filled symbols) and in the presence of 20 mm NH4Cl to alkalinize the intracellular medium (open symbols). The increases in the normalized current produced by intracellular alkalinization with NH4Cl measured at the value of the V½ of activation for each channel were 0.30 ± 0.009 to 0.36 ± 0.02 for WT bSLO3 (n = 7) at 0 mV, 0.8 ± 0.008 to 1.6 ± 0.14 at +70 mV for WT mSLO3 (n = 9), and 0.54 ± 0.01 to 1.1 ± 0.06 at +50 mV for the mSLO3–2 His mutant (n = 9). Note that intracellular alkalinization has less effect on WT bSLO3 than on WT mSLO3 channels, whereas the effect is very similar for both the WT mSLO3 channel and the mSLO3 mutant channel lacking two histidines (mSLO3 −2 His).
FIGURE 7.
FIGURE 7.
A subdivision of Subregion B confers bSLO3 kinetics on mSLO3 currents. A, current traces comparing the kinetics of activation of bSLO3, mSLO3, mSLO3-B chimera, and mSLO3-Bb chimera. The whole cell activation kinetics of the mSLO-B chimera and the mSLO3-Bb mutant resemble those of WT bSLO3. B, voltage dependence of the activation time constant (τact) of the same channels as in A. The bSLO3 τact and the mSLO-B and mSLO3-Bb τact are similarly voltage independent, only changing from ∼9 to 7 ms in the 0 to +80 voltage range, whereas mSLO3 τact is more voltage dependent, changing from ∼22 ms at 0 mV to 15 ms at +80 mV. mSLO3-Ba has τact values similar to mSLO3 but shows less voltage dependence with τact values ranging from 15 to 14 ms in the same voltage range.
FIGURE 8.
FIGURE 8.
Physical location of Subregion B within RCK1. Alignment of the amino acid sequences of the RCK1 domains of both eukaryotic (SLO3 and SLO1) and prokaryotic potassium channels (MethK and A. aeo2TM) based on the work of Jiang et al. (21) show the position of subregion B. Because the sequence of SLO3 potassium channels is co-linear and conserved with that of SLO1 potassium channels, we were able to add the SLO3 RCK1 domain to that alignment. This alignment revealed that subregion B is a loop between the αG helix and the βG strand of the RCK1 domain and serves to link the αG helix of the intermediate subdomain to the C-terminal subdomain. This loop region contains the greatest sequence and length polymorphisms among RCK1 domains of many species, as shown by the RCK1 sequence alignment of Ref. . This region also has unusually low sequence conservation in bovine and mouse SLO3 channels (see Fig. 1A, as well as this figure). The arrow in the three-dimensional molecular diagram indicates the loop position as based on the crystal structure (21). The presence of RCK domains in SLO1 channels was first reported by Jiang et al. (21), who inferred their presence in SLO1 channels by their sequence homology to the RCK domains of MthK and other prokaryotic ion channels. The presence of RCK domains in SLO3 channels is inferred by the high amino acid sequence homology of the mSLO1 and mSLO3 paralogues (4). Notably, the sequence identity between the putative RCK1 domains of SLO1 and SLO3 channels is much higher (>50%) than the sequence identity between putative RCK1 domains of SLO1 and MthK channels (<20%), from which the presence of RCK domains in SLO1 family channels was originally inferred. A published study has also concluded that both RCK1 and RCK2 domains are present in all SLO family channels, SLO1, SLO2, and SLO3 (30).

References

    1. Wyckoff G. J., Wang W., Wu C. I. (2000) Nature 403, 304–309 - PubMed
    1. Swanson W. J., Vacquier V. D. (2002) Nat. Rev. Genet. 3, 137–144 - PubMed
    1. Torgerson D. G., Kulathinal R. J., Singh R. S. (2002) Mol. Biol. Evol. 19, 1973–1980 - PubMed
    1. Schreiber M., Wei A., Yuan A., Gaut J., Saito M., Salkoff L. (1998) J. Biol. Chem. 273, 3509–3516 - PubMed
    1. Butler A., Tsunoda S., McCobb D. P., Wei A., Salkoff L. (1993) Science 261, 221–224 - PubMed

Publication types

MeSH terms

Substances