

Predators indirectly control vector-borne disease: linking predator-prey and host-pathogen models
- PMID: 19474078
- PMCID: PMC2839384
- DOI: 10.1098/rsif.2009.0131
Predators indirectly control vector-borne disease: linking predator-prey and host-pathogen models
Abstract
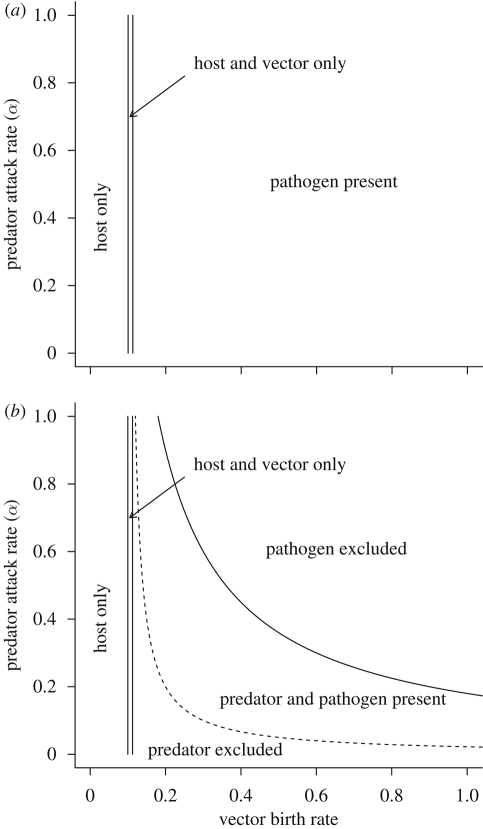
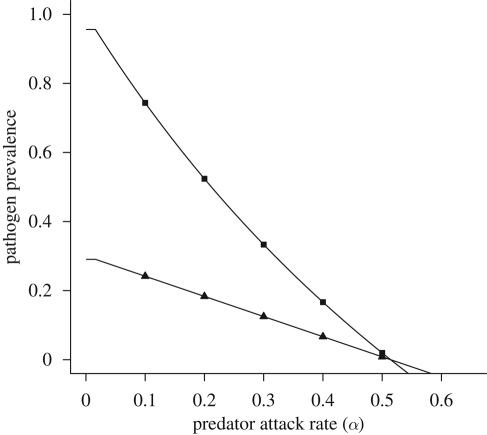
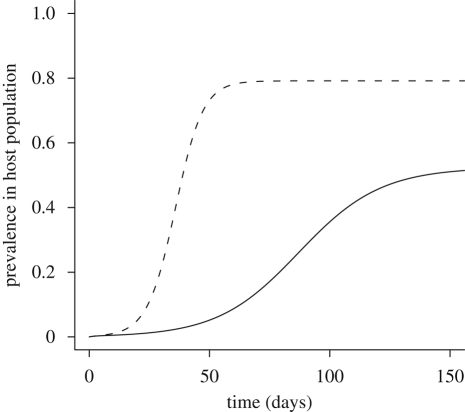
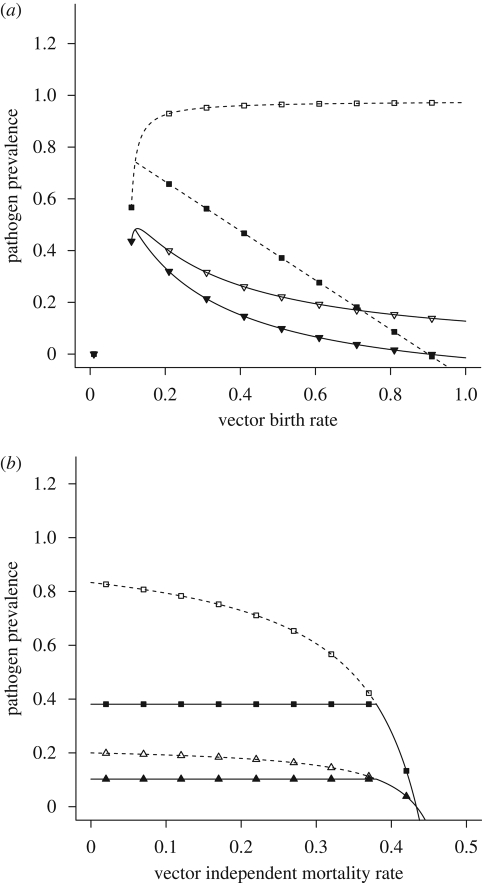
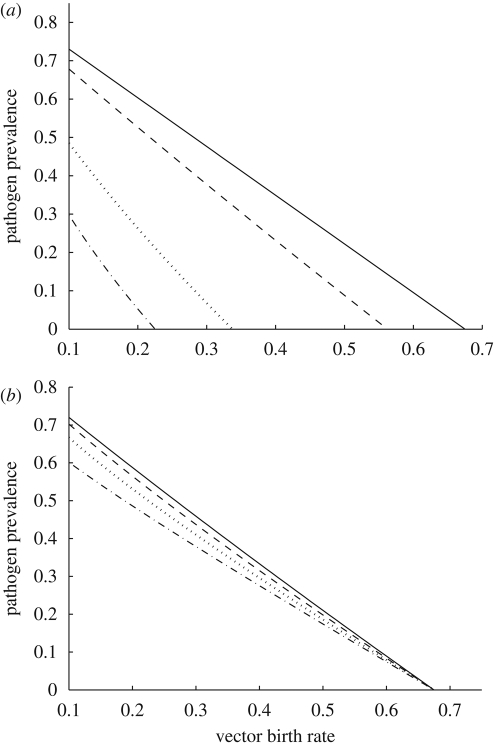
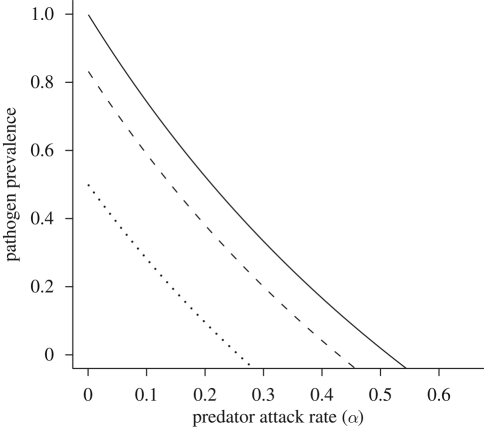
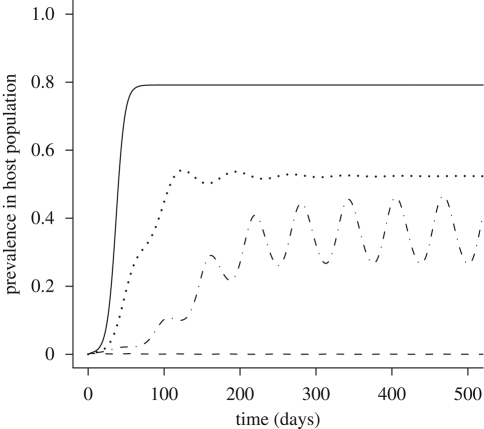
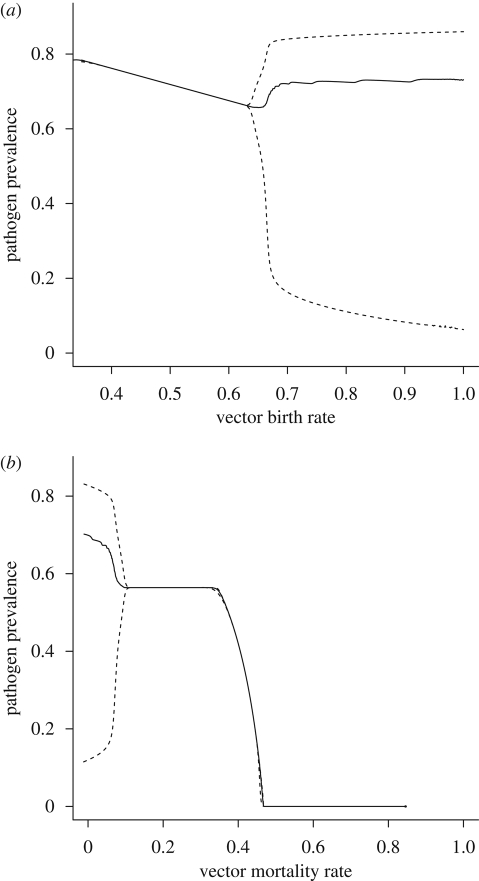
Pathogens transmitted by arthropod vectors are common in human populations, agricultural systems and natural communities. Transmission of these vector-borne pathogens depends on the population dynamics of the vector species as well as its interactions with other species within the community. In particular, predation may be sufficient to control pathogen prevalence indirectly via the vector. To examine the indirect effect of predators on vectored-pathogen dynamics, we developed a theoretical model that integrates predator-prey and host-pathogen theory. We used this model to determine whether predation can prevent pathogen persistence or alter the stability of host-pathogen dynamics. We found that, in the absence of predation, pathogen prevalence in the host increases with vector fecundity, whereas predation on the vector causes pathogen prevalence to decline, or even become extinct, with increasing vector fecundity. We also found that predation on a vector may drastically slow the initial spread of a pathogen. The predator can increase host abundance indirectly by reducing or eliminating infection in the host population. These results highlight the importance of studying interactions that, within the greater community, may alter our predictions when studying disease dynamics. From an applied perspective, these results also suggest situations where an introduced predator or the natural enemies of a vector may slow the rate of spread of an emerging vector-borne pathogen.
Figures
Similar articles
-
Predators indirectly reduce the prevalence of an insect-vectored plant pathogen independent of predator diversity.Oecologia. 2015 Apr;177(4):1067-74. doi: 10.1007/s00442-014-3194-1. Epub 2015 Jan 7. Oecologia. 2015. PMID: 25561170
-
Effects of predator modulation and vector preference on pathogen transmission in plant populations.Biosystems. 2022 Dec;222:104794. doi: 10.1016/j.biosystems.2022.104794. Epub 2022 Oct 17. Biosystems. 2022. PMID: 36257470
-
Predators, parasitoids, and pathogens: a cross-cutting examination of intraguild predation theory.Ecology. 2007 Nov;88(11):2681-8. doi: 10.1890/06-1707.1. Ecology. 2007. PMID: 18051634 Review.
-
Intraguild predation decreases predator fitness with potentially varying effects on pathogen transmission in a herbivore host.Oecologia. 2020 Aug;193(4):789-799. doi: 10.1007/s00442-020-04665-1. Epub 2020 May 17. Oecologia. 2020. PMID: 32419048
-
Larval predation in malaria vectors and its potential implication in malaria transmission: an overlooked ecosystem service?Parasit Vectors. 2019 May 8;12(1):217. doi: 10.1186/s13071-019-3479-7. Parasit Vectors. 2019. PMID: 31068213 Free PMC article. Review.
Cited by
-
Re-emphasizing mechanism in the community ecology of disease.Funct Ecol. 2021 Nov;35(11):2376-2386. doi: 10.1111/1365-2435.13892. Epub 2021 Jul 23. Funct Ecol. 2021. PMID: 37860273 Free PMC article.
-
Landscape variation influences trophic cascades in dengue vector food webs.Sci Adv. 2018 Feb 21;4(2):eaap9534. doi: 10.1126/sciadv.aap9534. eCollection 2018 Feb. Sci Adv. 2018. PMID: 29507879 Free PMC article.
-
Host infection and community composition predict vector burden.Oecologia. 2021 Jun;196(2):305-316. doi: 10.1007/s00442-021-04851-9. Epub 2021 Feb 12. Oecologia. 2021. PMID: 33580399
-
Both consumptive and non-consumptive effects of predators impact mosquito populations and have implications for disease transmission.Elife. 2022 Jan 19;11:e71503. doi: 10.7554/eLife.71503. Elife. 2022. PMID: 35044908 Free PMC article.
-
Predators indirectly reduce the prevalence of an insect-vectored plant pathogen independent of predator diversity.Oecologia. 2015 Apr;177(4):1067-74. doi: 10.1007/s00442-014-3194-1. Epub 2015 Jan 7. Oecologia. 2015. PMID: 25561170
References
-
- Anderson R. M., May R. M. C. 1991. Infectious diseases of humans: dynamics and control. Oxford, UK: Oxford University Press.
-
- Antonovics J., Iwasa Y., Hassell M. P. 1995. A generalized model of parasitoid, venereal, and vector-based transmission processes. Am. Nat. 145, 661–675. (10.1086/285761) - DOI
-
- Begon M., Bowers R. G., Kadianakis N., Hodgkinson D. E. 1992. Disease and community structure: the importance of host self-regulation in a host–host–pathogen model. Am. Nat. 139, 1131–1150. (10.1086/285379) - DOI
MeSH terms
LinkOut - more resources
Full Text Sources
Medical
