. 2009 Aug;83(16):7982-95.
doi: 10.1128/JVI.00259-09. Epub 2009 May 27.

Deficiency of niemann-pick type C-1 protein impairs release of human immunodeficiency virus type 1 and results in Gag accumulation in late endosomal/lysosomal compartments

Affiliations

Deficiency of niemann-pick type C-1 protein impairs release of human immunodeficiency virus type 1 and results in Gag accumulation in late endosomal/lysosomal compartments

Yuyang Tang et al. J Virol. 2009 Aug.

Abstract

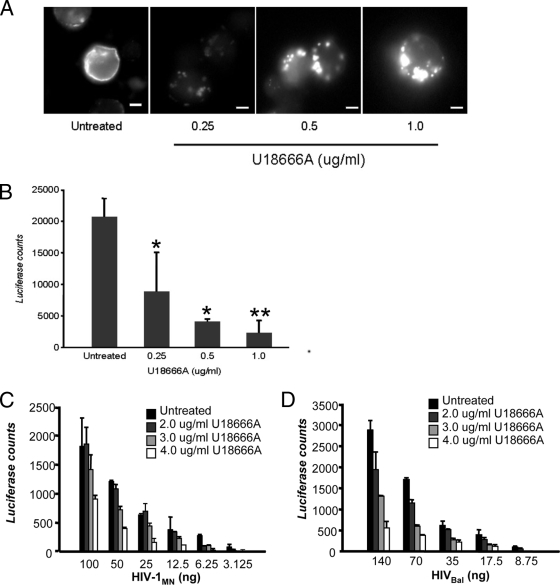
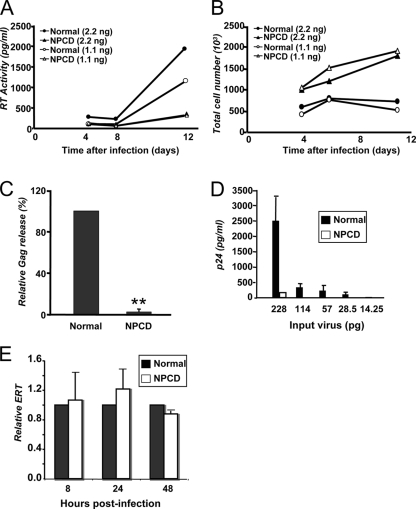
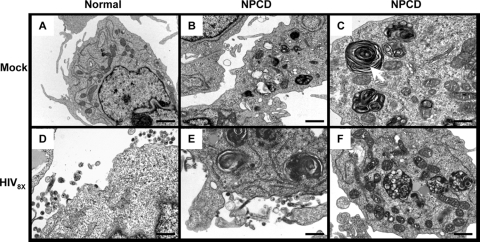
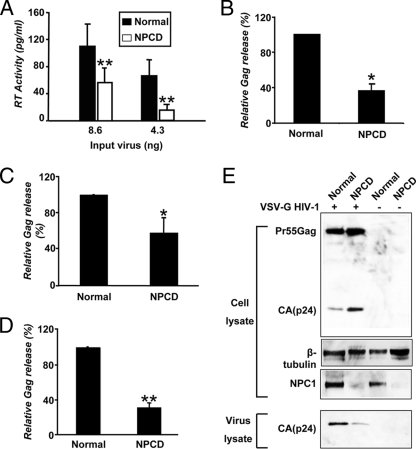
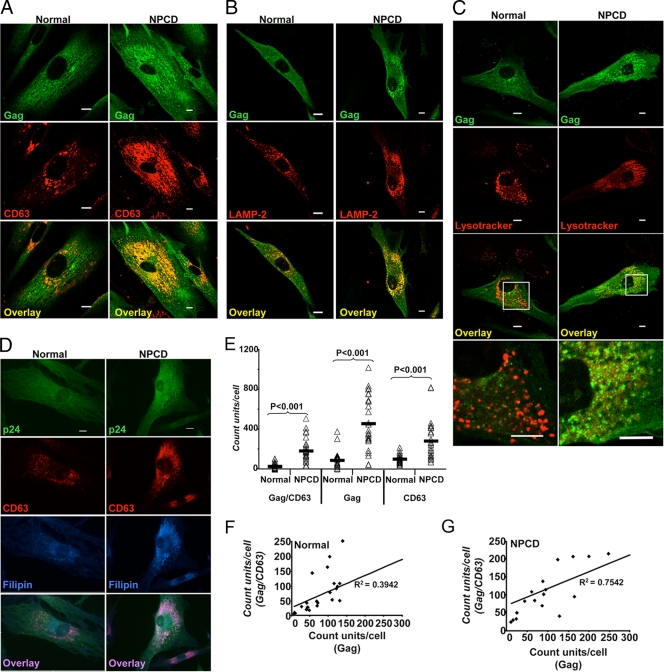
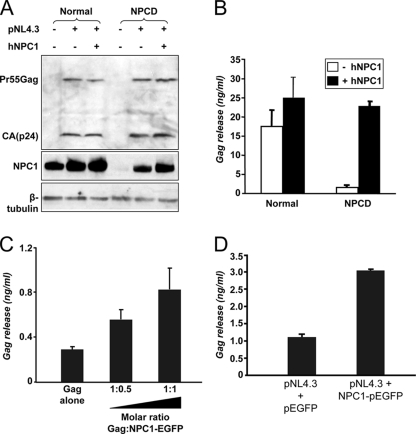
Human immunodeficiency virus type 1 (HIV-1) relies on cholesterol-laden lipid raft membrane microdomains for entry into and egress out of susceptible cells. In the present study, we examine the need for intracellular cholesterol trafficking pathways with respect to HIV-1 biogenesis using Niemann-Pick type C-1 (NPC1)-deficient (NPCD) cells, wherein these pathways are severely compromised, causing massive accumulation of cholesterol in late endosomal/lysosomal (LE/L) compartments. We have found that induction of an NPC disease-like phenotype through treatment of various cell types with the commonly used hydrophobic amine drug U18666A resulted in profound suppression of HIV-1 release. Further, NPCD Epstein-Barr virus-transformed B lymphocytes and fibroblasts from patients with NPC disease infected with a CD4-independent strain of HIV-1 or transfected with an HIV-1 proviral clone, respectively, replicated HIV-1 poorly compared to normal cells. Infection of the NPCD fibroblasts with a vesicular stomatitis virus G-pseudotyped strain of HIV-1 produced similar results, suggesting a postentry block to HIV-1 replication in these cells. Examination of these cells using confocal microscopy showed an accumulation and stabilization of Gag in LE/L compartments. Additionally, normal HIV-1 production could be restored in NPCD cells upon expression of a functional NPC1 protein, and overexpression of NPC1 increased HIV-1 release. Taken together, our findings demonstrate that intact intracellular cholesterol trafficking pathways mediated by NPC1 are needed for efficient HIV-1 production.


Figures

FIG. 1.
FIG. 1.
U18666A treatment of cells causes cholesterol accumulation and inhibits HIV-1 production. (A) LuSIV cells were untreated or treated with U18666A at the concentrations indicated. The cells were stained with filipin and examined by fluorescence microscopy to determine cholesterol phenotypic changes. Scale bars represent 20 μm. (B) LuSIV cells were untreated or treated with U18666A at the concentrations indicated for 24 h and then exposed to 10 ng of HIV-1MN for 48 h in the presence of the compound at the pretreatment concentration. Virus production was measured using a luciferase assay. The data shown represent the mean ± standard deviation from three independent experiments. *, P < 0.05; **, P < 0.001, compared to cells without U18666A treatment. TZM-bl cells were untreated or treated with U18666A at the indicated concentrations and exposed to X4-tropic HIV-1MN (3.125 to 100 ng p24/2 × 104 cells) (C) or R5-tropic HIV-1BaL (8.75 to 140 ng p24/2 × 104 cells) (D) for 48 h in the presence of the compound at the pretreatment concentration. Virus replication was measured using a luciferase assay. The data shown represent the mean ± standard deviation from three independent experiments.
FIG. 2.
FIG. 2.
HIV-1 replication is suppressed in NPCD lymphoblasts. (A) Normal lymphoblasts (circles) and NPCD lymphoblasts (triangles) were infected with either 2.2 ng (filled) or 1.1 ng (open) of HIV8X. At 4, 6, and 11 days postinfection, RT activity in the supernatant was measured. The results shown are the means of five independent experiments. (B) Total cell number was determined for each of the infected cell populations represented in panel A at the same time points after infection. The results shown are the mean of five independent experiments. (C) Normal and NPCD lymphoblasts were infected with 2.2 ng of HIV8X. At 30 days postinfection, the amount of Gag released into the supernatant was measured by a standard p24 ELISA. The relative amounts of Gag are the percentage of normal cells infected with the same amount of virus (arbitrarily set as 100%). The results shown represent the mean ± standard deviation from three independent experiments. **, P < 0.001, compared to infected normal lymphoblasts. (D) Normal (black bars) and NPCD (white bars) lymphoblasts were infected with 2.2 ng of HIV8X. At 15 days postinfection, virus-containing supernatants were collected and purified. Virus produced from each cell type was normalized by p24, and comparable amounts were used to infect Jurkat cells. The amount of Gag released by the Jurkat cells into the supernatant was measured by a standard p24 ELISA. The results shown represent the mean ± SD from three independent experiments. (E) Relative levels of HIV-1ERT were quantified by real-time PCR in HIV8X-infected normal (black bars) and NPCD (white bars) lymphoblast cells at the indicated time points. The relative ERT is normalized to normal cells (arbitrarily set as 1). The results shown represent the mean ± standard deviation from three independent experiments.
FIG. 3.
FIG. 3.
Viral particle assembly and budding are impaired in HIV-1-infected NPCD lymphoblasts. Normal (A and D) and NPCD lymphoblasts (B, C, E, and F) were uninfected (A, B, and C) or infected (D, E, and F) with 2.2 ng of HIV8X. At 20 days postinfection, the cells were processed for and examined by electron microscopy. (C) Arrow depicts multilamellar body. Bar, 1 μm (A and B); bar, 100 nm (C); bar, 200 nm (D and E); bar, 100 nm (F).
FIG. 4.
FIG. 4.
Dominant inhibition of particle assembly/release in NPCD cells either infected with VSV-G-pseudotyped virus or transfected with a proviral clone and Gag expression vector. (A) The effects of NPCD lymphoblasts on NL4.3 viral particle release with VSV-G-pseudotyped virus infection. Normal (black bars) and NPCD B-lymphoblast (white bars) cells were infected with indicated concentrations of VSV-G HIV-1. RT activity in the supernatant was quantified after 48 h. (B) Normal and NPCD fibroblasts were infected with VSV-G HIV-1 (2 to 3 μg p24/106 cells). Gag antigen release into the supernatant was also measured by an antigen-capture ELISA. The relative amounts of Gag are percentages of infected normal cells (arbitrarily set as 100%). (C) Normal and NPCD fibroblasts were transfected with pNL4.3. 48 h posttransfection, the amount of Gag released into the supernatant was measured by a standard p24 ELISA. The relative amounts of Gag are percentages of transfected normal cells (arbitrarily set as 100%). The results shown represent the mean ± standard deviation from three independent experiments. *, P < 0.005, compared to infected normal fibroblasts. (D) NPCD and normal fibroblasts were transfected with a Gag expression vector. 48 h posttransfection, the amount of Gag released into the supernatant was measured by a standard p24 ELISA. Viral release data shown are normalized to percentages of infected/transfected cells, as determined by flow cytometry using anti-Gag antibody. The relative amounts of Gag are percentages of transfected normal cells (arbitrarily set as 100%). (E) Cells infected as described for panel B. After 96 h of infection, whole-cell lysates (upper three panels) and viral lysates (lower panel) were harvested and analyzed by immunoblotting using anti-Gag, anti-NPC1, and anti-β-tubulin antibodies. Data shown represent the mean ± standard deviations from three independent experiments. *, P < 0.05 **, P < 0.001, compared to normal cells (A, B, C, and D).
FIG. 5.
FIG. 5.
Colocalization of HIV Gag and LE and L markers in NPCD fibroblasts cells. Primary NPCD and normal fibroblasts were infected with NL4.3-VSV-G-pseudotyped virus. Cells were fixed at 96 h postinfection and immunostained. (A, B, C and D) Gag is shown in green, the LE/L marker in red, cholesterol in blue, and colocalized pixels in yellow or pink. Size bars represent 10 μm. Gag (green) is seen colocalized extensively with LE/L marker (red) CD63 (A), Lamp2 (B), and Lysotracker Red (C) in NPCD cells. (D) Gag (green) is seen colocalized with cholesterol (blue) and CD63 (red) in NPCD cells. Cholesterol was stained with filipin. (E) Quantitation of Gag/CD63 colocalization. The intracellular puncta of Gag, CD63, and Gag colocalizing with CD63 were quantified using Nikon Elements Advanced Research software for 26 NPCD cells and normal cells each. Δ represents the puncta count from each cell, and represents the mean of 26 cells in each group. Correlations between total intracellular Gag puncta and Gag puncta colocalizing with CD63 in normal cells (F) and NPCD cells (G).
FIG. 6.
FIG. 6.
Exogenous NPC1 restores Gag release in NPCD cells to normal levels, and NPC1 overexpression correlates with increased Gag release. (A, B) Normal or NPCD fibroblasts were cotransfected with the pNL4.3 proviral clone and either an NPC1 expression vector or empty vector. Samples were harvested after 24 h of transfection. (A) Cell lysates were collected and analyzed by immunoblotting with anti-NPC1 antibody after normalizing by amount of protein (top blot). The level of Gag protein and β-tubulin was detected by Western blotting with anti-Gag (middle) and anti-β-tubulin (bottom). (B) Amount of Gag released in the supernatant was quantified by a p24 ELISA. Data shown represent the mean ± standard deviation from two independent experiments. (C) Overexpression of NPC1 in TZM-bl cells increases Gag particle release. TZM-bl cells were transfected with a Gag plasmid and with increasing amounts of NPC1-enhanced GFP DNA, as indicated. Gag released in the supernatant was quantified by p24 capture ELISA. Data shown represent the mean±SD from two independent experiments. (D) Overexpression of NPC1 in TZM-bl cells increases viral particle release. TZM-bl cells were transfected with pNL4.3 proviral DNA and cotransfected with either pEGFP or NPC1-enhanced GFP. The amount of Gag released in the supernatant was quantified 48 h post transfection using p24 ELISA. Data shown represent the mean ±SD from two independent experiments.

Similar articles

Cited by

References

    1. Alroy, I., S. Tuvia, T. Greener, D. Gordon, H. M. Barr, D. Taglicht, R. Mandil-Levin, D. Ben-Avraham, D. Konforty, A. Nir, O. Levius, V. Bicoviski, M. Dori, S. Cohen, L. Yaar, O. Erez, O. Propheta-Meiran, M. Koskas, E. Caspi-Bachar, I. Alchanati, A. Sela-Brown, H. Moskowitz, U. Tessmer, U. Schubert, and Y. Reiss. 2005. The trans-Golgi network-associated human ubiquitin-protein ligase POSH is essential for HIV type 1 production. Proc. Natl. Acad. Sci. USA 1021478-1483. - PMC - PubMed
    1. Berger, A. C., G. Salazar, M. L. Styers, K. A. Newell-Litwa, E. Werner, R. A. Maue, A. H. Corbett, and V. Faundez. 2007. The subcellular localization of the Niemann-Pick Type C proteins depends on the adaptor complex AP-3. J. Cell Sci. 1203640-3652. - PubMed
    1. Bishop, N. E. 2003. Dynamics of endosomal sorting. Int. Rev. Cytol. 2321-57. - PubMed
    1. Campbell, S. M., S. M. Crowe, and J. Mak. 2001. Lipid rafts and HIV-1: from viral entry to assembly of progeny virions. J. Clin. Virol. 22217-227. - PubMed
    1. Carroll, K. S., J. Hanna, I. Simon, J. Krise, P. Barbero, and S. R. Pfeffer. 2001. Role of Rab9 GTPase in facilitating receptor recruitment by TIP47. Science 2921373-1376. - PubMed

Publication types

MeSH terms

Substances