. 2009 Aug;102(2):817-30.
doi: 10.1152/jn.00020.2009. Epub 2009 May 27.

Optical imaging of postsynaptic odor representation in the glomerular layer of the mouse olfactory bulb

Affiliations

Optical imaging of postsynaptic odor representation in the glomerular layer of the mouse olfactory bulb

Max L Fletcher et al. J Neurophysiol. 2009 Aug.

Abstract

Olfactory glomeruli are the loci where the first odor-representation map emerges. The glomerular layer comprises exquisite local synaptic circuits for the processing of olfactory coding patterns immediately after their emergence. To understand how an odor map is transferred from afferent terminals to postsynaptic dendrites, it is essential to directly monitor the odor-evoked glomerular postsynaptic activity patterns. Here we report the use of a transgenic mouse expressing a Ca(2+)-sensitive green fluorescence protein (GCaMP2) under a Kv3.1 potassium-channel promoter. Immunostaining revealed that GCaMP2 was specifically expressed in mitral and tufted cells and a subpopulation of juxtaglomerular cells but not in olfactory nerve terminals. Both in vitro and in vivo imaging combined with glutamate receptor pharmacology confirmed that odor maps reported by GCaMP2 were of a postsynaptic origin. These mice thus provided an unprecedented opportunity to analyze the spatial activity pattern reflecting purely postsynaptic olfactory codes. The odor-evoked GCaMP2 signal had both focal and diffuse spatial components. The focalized hot spots corresponded to individually activated glomeruli. In GCaMP2-reported postsynaptic odor maps, different odorants activated distinct but overlapping sets of glomeruli. Increasing odor concentration increased both individual glomerular response amplitude and the total number of activated glomeruli. Furthermore, the GCaMP2 response displayed a fast time course that enabled us to analyze the temporal dynamics of odor maps over consecutive sniff cycles. In summary, with cell-specific targeting of a genetically encoded Ca(2+) indicator, we have successfully isolated and characterized an intermediate level of odor representation between olfactory nerve input and principal mitral/tufted cell output.


Figures
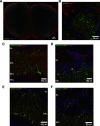
FIG. 1.
FIG. 1.
Ca2+-sensitive green fluorescence protein (GCaMP2) is specifically expressed in olfactory bulb neurons that are postsynaptic to olfactory sensory terminals. A: an olfactory bulb section triple stained with anti-olfactory marker protein (OMP, red), anti-GFP (green), and 4′,6-diamino-2-phenylindole dihydrochrolide (DAPI, blue) reveals GCaMP2 expression throughout the glomerular (GL), external plexiform (EPL), and mitral cell layers (MCL). No GCaMP2 expression was seen in the olfactory nerve layer (ONL) or granule cell layer (GCL). B: high-magnification image of a single glomerulus shows no overlap between GCaMP2-positive cell dendrites (green) and olfactory sensory axons (red). C and D: intrinsic GCaMP2 fluorescence in olfactory bulb sections double stained with anti-GAD67 (green) and DRAQ5 (blue). The somata and dendrites of mitral cells, tufted cells, and a subset of juxtaglomerular cells express GCaMP2, whereas no GCaMP2-positive granule cells can be seen. No GAD67-positive GCaMP2 expressing cells were observed in any layer, suggesting GCaMP2 is not expressed in the inhibitory neurons of the olfactory bulb. E and F: co-expression of Tbx21 (red), a mitral/tufted cell marker, in many GCaMP2 cells (green) indicates that a majority of GCaMP2-positive cells are mitral and tufted cells.
FIG. 2.
FIG. 2.
Odorant-evoked GCaMP2 Ca2+ response in the olfactory bulb. A left: an in vivo resting fluorescence image of the olfactory bulb dorsal surface observed through thinned skull in a GCaMP2 mouse. The visible range of dorsal bulbar surface is outlined in white. Right: a single-trial odor response map induced by butyraldehyde (0.25% of saturated vapor). Two numbered white arrows indicate the locations where the odor-evoked response traces shown in B were obtained. The yellow arrow points to the weak and diffusive GCaMP2 response profile, as compared with more focalized hot spots (exemplified by white arrow 2). B, top: raw fluorescence traces without correcting for photo-bleaching. The red and gray traces are the GCaMP2 signals measured, respectively, at odor activated and nonactivated regions, as indicated in A by the two white arrows. A black horizontal bar indicates a 2-sec odor delivery. Bottom: the same odor-responses with photo-bleaching subtracted by using a no-odor imaging trial. C: comparison of the averaged ΔF/F response profile obtained from odor-evoked hot spots in the GCaMP2 mice (cyan) and from synaptopHluorin (SpH)-labeled olfactory glomeruli in the OMP-SpH mice (red). Inset: the profile was measured along a transverse line through the center of a typical responsive spot. For each spot, signals at different sites were normalized to the peak of the profile. The profiles from different GCaMP2 hot spots or SpH-labeled glomeruli were then averaged, respectively, by aligning their response peaks. D: quantitative comparison of the mean widths measured at half-maximum in the GCaMP2 and OMP-SpH mice. E: odor-evoked GCaMP2 response maps were bilaterally symmetrical.
FIG. 3.
FIG. 3.
In vitro pharmacological identification of the postsynaptic origin of GCaMP2 fluorescence response signals. A: a resting fluorescence image of the ONL, GL, and EPL in a horizontally-cut olfactory bulb slice preparation. Individual glomeruli are outlined by white dashed cycles. Regions of interest (ROIs) are illustrated as small solid black circles from which signal traces in B were measured. A white arrow indicates the tip of a concentric bipolar stimulating electrode. B: control, a train of electric stimuli (50 μA, 20 pulses at 40 Hz) was delivered to the ONL and evoked GCaMP2 fluorescence response both in the glomerular and external plexiform layer. The traces numbered 1–8 correspond to the ROIs labeled in A. 6-cyano-7-nitroquinoxalene-2,3-dione (CNQX) and d(−)-2-amino-5-phosphonopentanoic acid (APV), bath application of ionotropic glutamate receptor antagonists (20 μM CNQX and 50 μM APV) blocked the GCaMP2 responses, indicative of a postsynaptic origin of signals. Washout, the GCaMP2 response was partially recovered with washout.
FIG. 4.
FIG. 4.
Pharmacological analysis of the ON-evoked GCaMP2 response. A: an infrared DIC imaging of an olfactory bulb slice prepared from a GCaMP2 mouse. The borders between the ONL, GL and EPL are delineated with 2 white dashed lines. The black shade located near the left margin of the image is the tip of a concentric bipolar stimulating electrode used to activate olfactory nerve input. The numbered circles mark the ROIs from which GCaMP2 signal traces in D were measured. B: electric stimulation-evoked GCaMP2 response increased with stimulus intensity. Data were sampled from ROI 3. C: plot of ΔF/F versus the stimulus current. The blue and red arrows denote the low and high stimulus intensities with which the data in D were imaged. D: spatial profile and pharmacology of GCaMP2 signals evoked by the 2 different stimulus intensities. Left: control responses. Middle: bath application of 50 μM APV selectively blocked the glomerular GCaMP2 responses to the weak stimulus, but only partially suppressed the strong stimulus-evoked responses. Right: wash-out.
FIG. 5.
FIG. 5.
In vivo pharmacology of the odor-evoked GCaMP2 response signal. A: electric stimulation of the ONL-induced GCaMP2 Ca2+ response in a string of glomeruli located on the dorsal olfactory bulb surface. Here a pseudocolor response map is superimposed on a resting fluorescence image. B: olfactory nerve stimulation-induced GCaMP2 response patterns before (control), during, and after (washout) bath application of both ionotropic and metabotropic glutamate receptor antagonists (0.5 mM NBQX, 2.5 mM CGP 37849, and 1.0 mM LY 341495). C: stimulation-evoked GCaMP2 fluorescence increase in individual glomeruli was abolished by the drug application and with washout recovered to a near control level. The traces shown here were obtained from a glomerulus indicated by a white arrow in B. A black arrow indicates a single electric-pulse stimulus. D: statistics of evoked GCaMP2 responses under the control, drug application and washout conditions. An asterisk indicates a significant difference between the control and drug groups (P < 0.001).
FIG. 6.
FIG. 6.
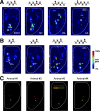
Spatial coding of odorant identity. A: odor response maps in the same animal to pentanal (5CHO), methyl valerate (MV), butyl acetate (BA), and amyl acetate (AA), each at 0.5% of saturated vapor. The molecular structure of each odorant is displayed above each map. B: response maps from a different animal to a homologous series of aliphatic aldehydes (3CHO-6CHO) at near-threshold concentrations. A white arrow indicates a glomerulus that was responsive to all odorants in the series. Each map is scaled to its own maximum ΔF/F. For comparison, the molecular structure of each odorant is shown above the map. C: Disstribution of the centers of “mass” for each glomerular activation pattern evoked by 1 of the 4 aldehydes at near-threshold concentration. Left-most panel: the response centers computed from the odor maps in B; other 3 panels:obtained from 3 different animals.
FIG. 7.
FIG. 7.
Coding of odor concentration at the postsynaptic glomerular level. A: odor maps in response to pentanal at 0.13, 1.0, and 10% of saturated vapor. Increasing odor concentration increased both individual glomerular response amplitudes and the total number of responding glomeruli. For comparison, all three maps are scaled to the same range (10–90%) of the maximum ΔF/F recorded in the 10% odor concentration map. Right-most panel: the glomeruli used for generating the plots in C. At high concentrations such as 10%, spatial filtering caused some glomerular responses appearing weaker in the pseudo-color map, as high odor concentrations tended to induce a diffuse response signal that was distributed broadly across the bulbar surface. B: plot of the mean percentage of activated glomeruli vs. the odorant concentration. The data were pooled from 4 different animals in response to pentanal. For each animal, the percentage was calculated by normalizing the number of activated glomeruli at a given concentration to the total number of glomeruli activated by 1% of saturated vapor. C: odor concentration-response curves for the eight glomeruli labeled in A. All data were measured from raw images before spatial filter was applied. D: histogram of the Hill coefficients (n) calculated by fitting the concentration-response curves of 45 glomeruli.
FIG. 8.
FIG. 8.
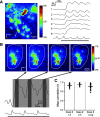
Correlation between odor-evoked GCaMP2 glomerular response signals with animal respiration cycles. A, left: a glomerular odor response map evoked by 0.25% propanal. Right: traces are the response time courses of six different glomeruli aligned with respiratory cycles. Note that glomeruli 1–3 displayed strong phasic responses that closely followed each inhalation. The upward deflections of the recorded respiratory trace represent inhalation, and a black horizontal bar indicates odorant delivery. B: odor response maps in 3 consecutive respiratory cycles (resp 1–3) following the onset of 0.25% methyl valerate delivery. The 2 traces below the maps reflect the odor-evoked GCaMP2 fluorescence signal in an activated glomerulus (white arrowhead) as well as its correlation with the animal's respiration activity. The overall pattern of activated glomeruli varied very little across different inhalation cycles. The response maps generated from each cycle (as indicated by 3 dark gray boxes) strongly resembled the left-most map, which was an average of GCaMP2 response signals across the entire first three respirations (light gray box). C: quantitative analysis via cross-correlation to test for the odor-map stability across the 1st 3 respiration cycles following odorant delivery. Data set was taken from 13 animals, from which 18 odor maps were imaged in response to 5 different odorants.

Similar articles

Cited by

References

    1. Abraham NM, Spors H, Carleton A, Margrie TW, Kuner T, Schaefer AT. Maintaining accuracy at the expense of speed: stimulus similarity defines odor discrimination time in mice. Neuron 44: 865–876, 2004. - PubMed
    1. Aroniadou-Anderjaska V, Zhou FM, Priest CA, Ennis M, Shipley MT. Tonic and synaptically evoked presynaptic inhibition of sensory input to the rat olfactory bulb via GABA(B) heteroreceptors. J Neurophysiol 84: 1194–1203, 2000. - PubMed
    1. Aungst JL, Heyward PM, Puche AC, Karnup SV, Hayar A, Szabo G, Shipley MT. Centre-surround inhibition among olfactory bulb glomeruli. Nature 426: 623–629, 2003. - PubMed
    1. Belluscio L, Katz LC. Symmetry, stereotypy, and topography of odorant representations in mouse olfactory bulbs. J Neurosci 21: 2113–2122, 2001. - PMC - PubMed
    1. Berkowicz DA, Trombley PQ, Shepherd GM. Evidence for glutamate as the olfactory receptor cell neurotransmitter. J Neurophysiol 71: 2557–2561, 1994. - PubMed

Publication types

MeSH terms

Substances

LinkOut - more resources