Immunological profiles of Bos taurus and Bos indicus cattle infested with the cattle tick, Rhipicephalus (Boophilus) microplus
- PMID: 19474263
- PMCID: PMC2708397
- DOI: 10.1128/CVI.00157-09
Immunological profiles of Bos taurus and Bos indicus cattle infested with the cattle tick, Rhipicephalus (Boophilus) microplus
Abstract
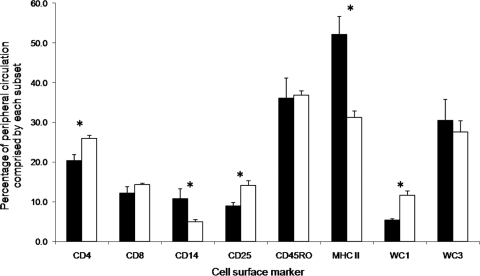
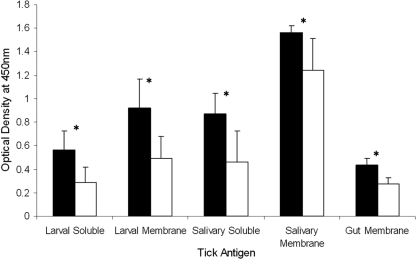
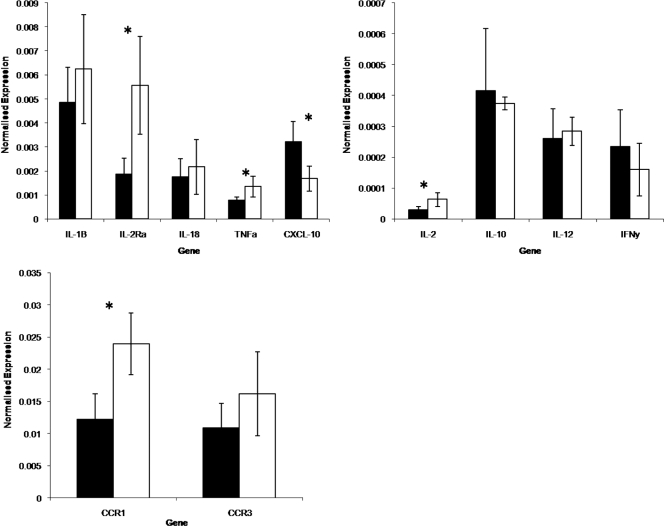
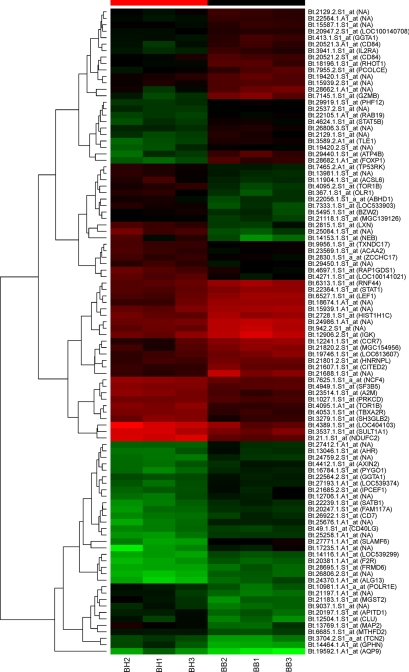
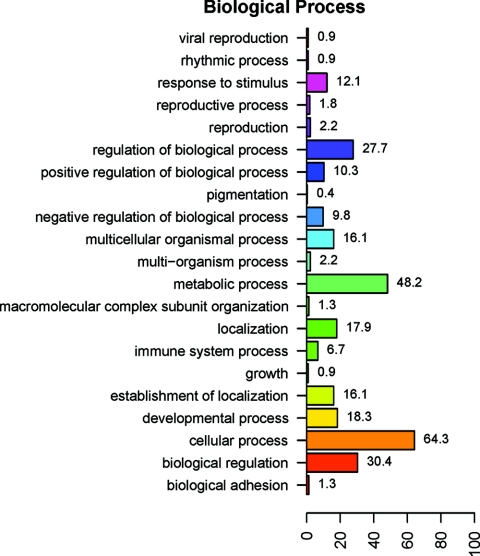
The cattle tick, Rhipicephalus (Boophilus) microplus, is a major threat to the improvement of cattle production in tropical and subtropical countries worldwide. Bos indicus cattle are naturally more resistant to infestation with the cattle tick than are Bos taurus breeds, although considerable variation in resistance occurs within and between breeds. It is not known which genes contribute to the resistant phenotype, nor have immune parameters involved in resistance to R. microplus been fully described for the bovine host. This study was undertaken to determine whether selected cellular and antibody parameters of the peripheral circulation differed between tick-resistant Bos indicus and tick-susceptible Bos taurus cattle following a period of tick infestations. This study demonstrated significant differences between the two breeds with respect to the percentage of cellular subsets comprising the peripheral blood mononuclear cell population, cytokine expression by peripheral blood leukocytes, and levels of tick-specific immunoglobulin G1 (IgG1) antibodies measured in the peripheral circulation. In addition to these parameters, the Affymetrix bovine genome microarray was used to analyze gene expression by peripheral blood leukocytes of these animals. The results demonstrate that the Bos indicus cattle developed a stabilized T-cell-mediated response to tick infestation evidenced by their cellular profile and leukocyte cytokine spectrum. The Bos taurus cattle demonstrated cellular and gene expression profiles consistent with a sustained innate, inflammatory response to infestation, although high tick-specific IgG1 titers suggest that these animals have also developed a T-cell response to infestation.
Figures
References
-
- Affymetrix. 2002. Statistical algorithms description document. Technical report. Affymetrix, Santa Clara, CA.
-
- Ashburner, M., C. Ball, J. Blake, D. Botstein, H. Butler, J. Cherry, A. Davis, K. Dolinski, S. Dwight, J. Eppig, M. Harris, D. Hill, L. Issel-Tarver, A. Kasarkis, S. Lewis, J. Matese, J. Richardson, M. Ringwald, G. Rubin, G. Sherlock, et al. 2000. Gene ontology: tool for the unification of biology. Nat. Genet. 2525-29. - PMC - PubMed
-
- Bolstad, B., F. Collin, J. Brettschneider, K. Simpson, L. Cope, R. Irizarry, and T. Speed. 2005. Quality assessment of Affymetrix GeneChip Data, p. 33-47. In R. Gentleman, V. Carey, W. Huber, R. Irizarry, and S. Dutoit (ed.), Bioinformatics and computational biology solutions using R and Bioconductor. Springer, New York, NY.
-
- Carvalho, W. A., G. H. Bechara, D. D. Moré, B. R. Ferreira, J. S. da Silva, and I. K. F. de Miranda Santos. 2008. Rhipicephalus (Boophilus) microplus: distinct acute phase proteins vary during infestations according to the genetic composition of the bovine hosts, Bos taurus and Bos indicus. Exp. Parasitol. 118587-591. - PubMed
-
- Cole, D., A. Roussel, and M. Whitney. 1997. Interpreting a bovine CBC: collecting and sample and evaluating the erythron. Vet. Med. 92460-468.
Publication types
MeSH terms
Substances
LinkOut - more resources
Full Text Sources
Other Literature Sources
Molecular Biology Databases